


There exists a common, higher-level architectural perspective that keeps the teams on track. Planning and decisions are quicker when the same big picture is viewed by the stakeholders and developers. The top-level context view eliminates confusion concerning the scope and the out of scope.
The first level of the C4 model is the C4 context diagram, also known as the system context diagram. It depicts the system at the centre, users, and external systems around it. Through this article, you will know what it is, why it is important, how its symbols are read, as well as how to draw one in EdrawMax.
In this article
What is a C4 Context Diagram
A C4 context diagram provides a high-level picture of a software system. It reveals the way the central system speaks to the individuals and other external systems. It does not go into the depths of the code or the servers, but rather the people who are using the system and what the system is being linked with.
This is the first level in the hierarchy of the C4 model diagrams: Context → Container→ Component→ Code. Imagine it as a map that prepares any technical design. It is a way for teams to agree on boundaries, users, and external services and then construct anything. The diagram provides answers to three questions:
- What is the core system?
- Who interacts with it?
- What external systems interface with it?
The system context diagram remains uncluttered with technology details and can be shared with the developers, stakeholders, or non-technical managers. It makes sure that everybody knows the scope and the relationships, and subsequent diagrams, containers, components, and code become much easier to write and maintain.
Building Blocks of C4 Context Diagram
A C4 context diagram is a diagram that describes the functionality of a system in simple shapes. Everything has a distinct purpose and makes everyone look at the scale without additional information.
1. Central System
- The heart of the diagram.
- Displayed as a huge box bearing the name of the software system.
- Symbolizes what your team is creating or sustaining.
2. Actors (People or Roles)
- The human role that interacts with the system can be end users, admins, or any other human.
- Normally depicted as stick figures or as labeled icons outside the system boundary.
- Demonstrate who is an input or output.
3. External Systems
- Other programs or services that are connected to your system.
- It can be databases, payment gateways, or third-party APIs.
- Indicated as distinct boxes over the central system.
4. Interaction Lines
- Actors and other external systems are connected to the central system via the arrows or lines.
- All arrows are supposed to be labeled to indicate the nature of the data or service being transferred.
The diagram does not include the specifics of technology, such as the programming language or database name. Its emphasis on scope and relationships makes it simple to read and allows all participants, including business leaders and developers, to have the same high-level understanding of it before any serious design work starts.
Symbols & Notation of C4 Context Diagram
A C4 context diagram is based on clear symbols and well-defined notation to ensure that anyone who views the system can understand it immediately. Shared common mental pictures amongst different teams are done through standard shapes, labels, and arrows, even when they lack the previous context. Stability, in this case, makes the whole software architecture diagram simple to read and maintain.
1. Boxes for Systems and People
- Software systems (both central and external) should be represented with the help of rectangles.
- People or roles should be looked at with rounded boxes or icons.
- Use constant sizes of boxes to achieve a neat, balanced appearance.
2. Labeled Entities
- Every box has to display the name, type (e.g., Person or Software System), and a concise description of why it is needed.
- Example: Customer Relationship Management System- External System: Processes all the debt payments.
- Labels eliminate everything to guess, and render the diagram self-explanatory.
3. Interaction Arrows and Lines.
- Strengthy arrows indicate information or command flow amongst parts.
- Put short text on every arrow, such as User Request or Order Data, to ensure that there is clarity in the communication.
4. System Boundary
- Mark ownership and scopes by drawing a big enclosing box around the central system.
- Other systems and individuals have been left outside this boundary.
5. Legends and Color Keys
- Include a little legend on the meaning of any color coding/icon.
- Colors and icons may differ.
- However, once selected, use them throughout the diagram.
Using these standards, a C4 context diagram can be transformed into a self-referent and complete reference. Developers, as well as business stakeholders, can get to know the connection between systems and actors; thus, such future updates and reviews can be easier and more precise.
How to Draw a C4 Context Diagram in EdrawMax
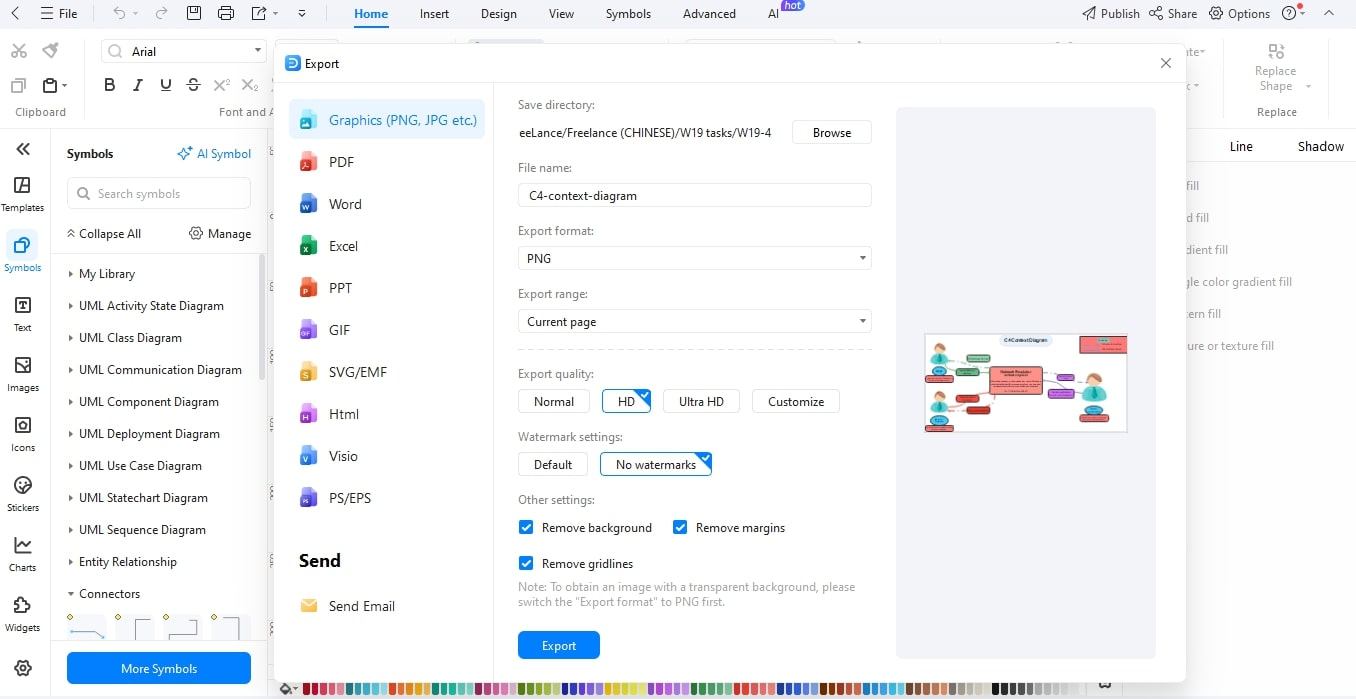
A C4 context diagram can appear to be an overwhelming task, but Edrawmax simplifies it and makes it quick. Built-in shape libraries and simple drag and drop tools allow you to capture ideas at a high level and instantly create a refined diagram in a few minutes. These are the procedures that one should follow in developing a professional and easy-to-read system context diagram on an empty canvas to be finally exported.
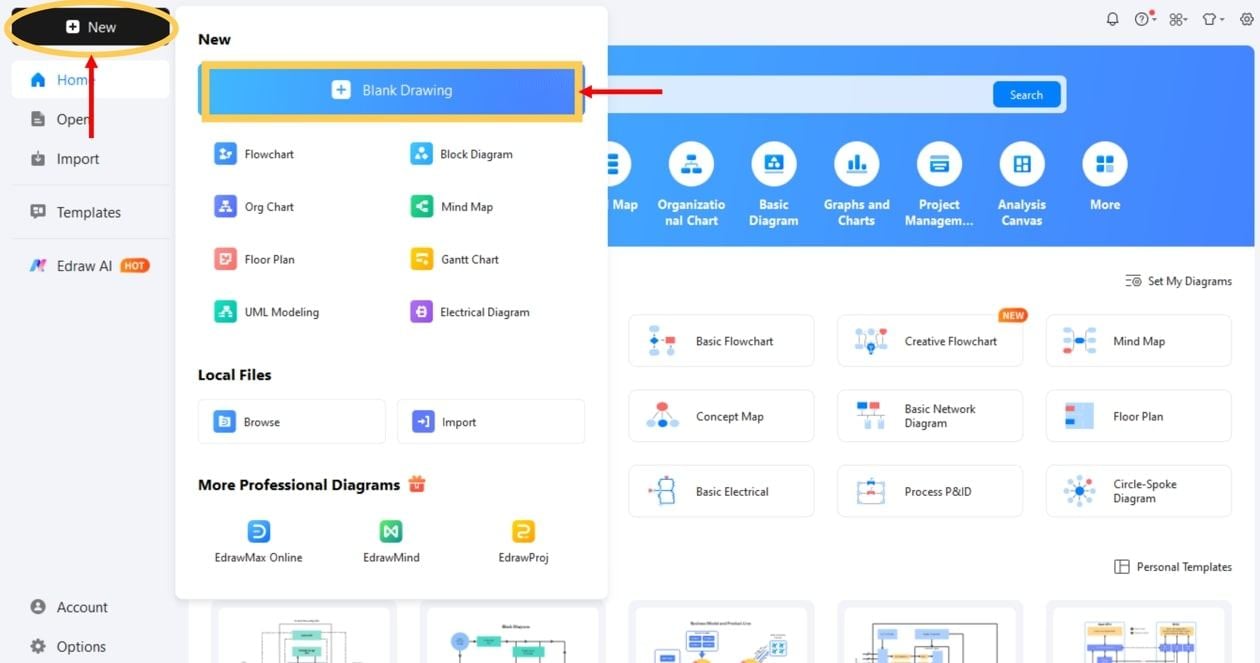
Step1 Create a New Project
- Open EdrawMax.
- Click New on the left panel.
- Click Blank Drawing on the menu to select a blank canvas.
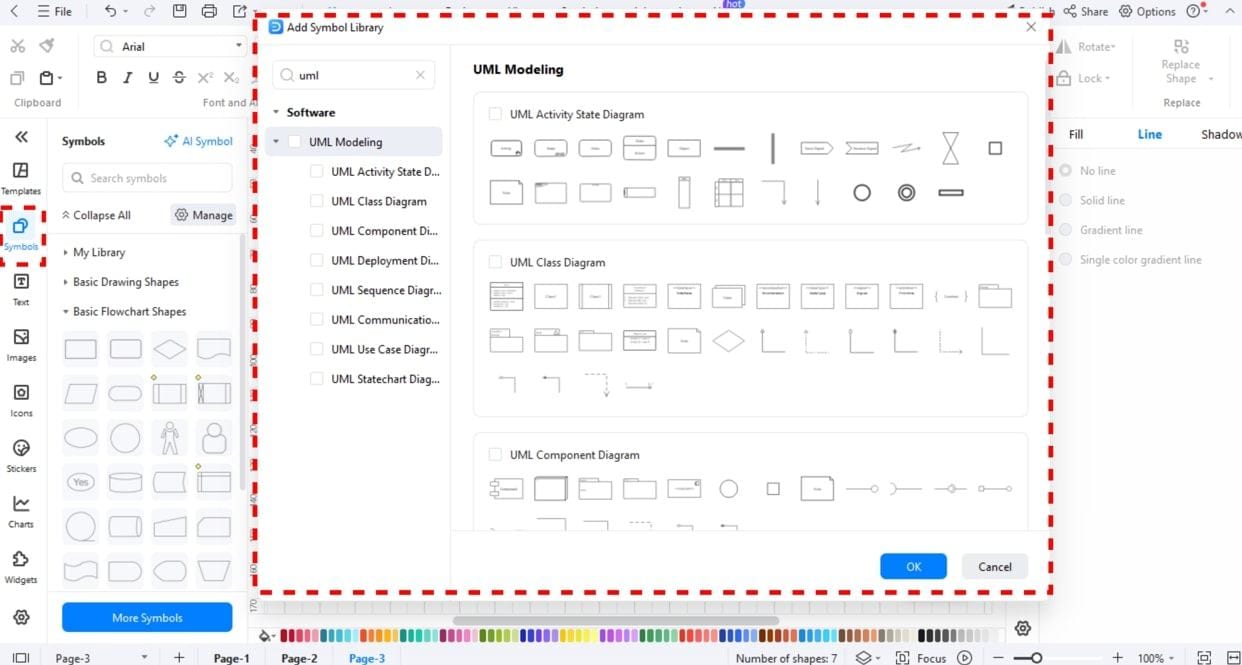
Step2 Enable Shape Libraries
- Click the left bar either under Click Symbols or More Symbols.
- Right-click Manage, then Add More Symbols.
- Allow such libraries as C4 / Software / Context or UML.
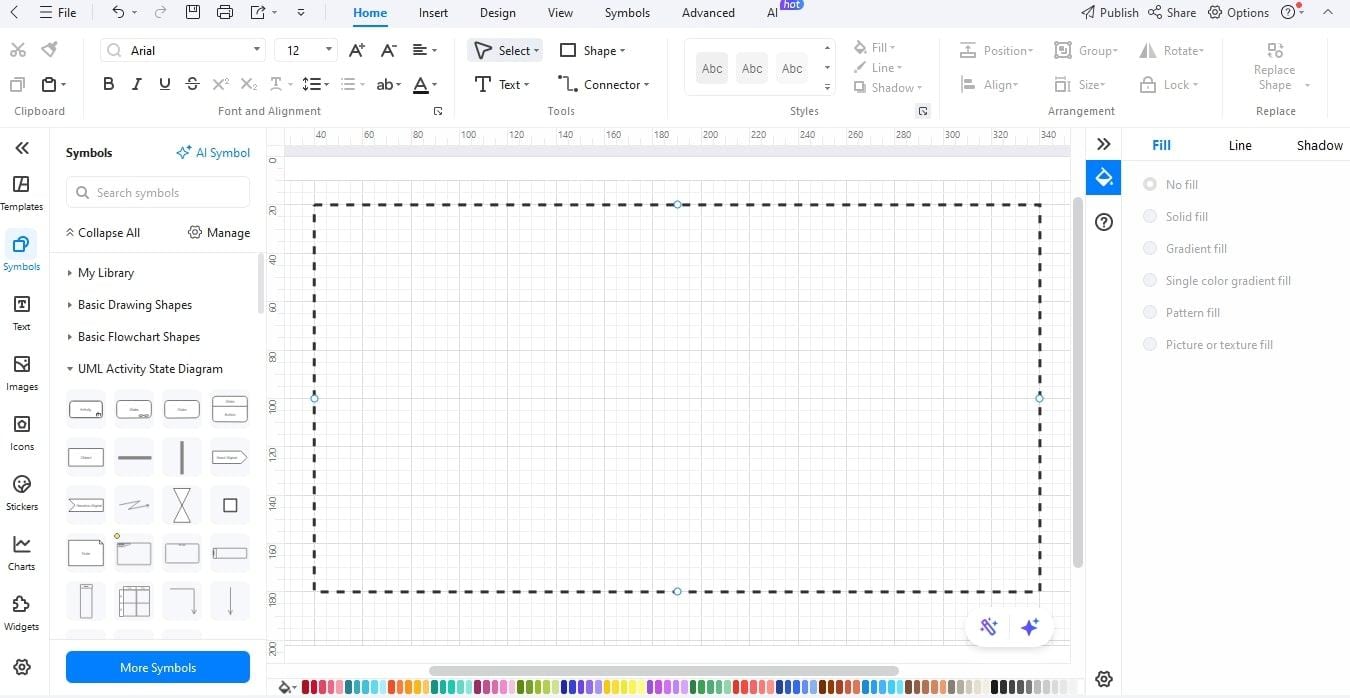
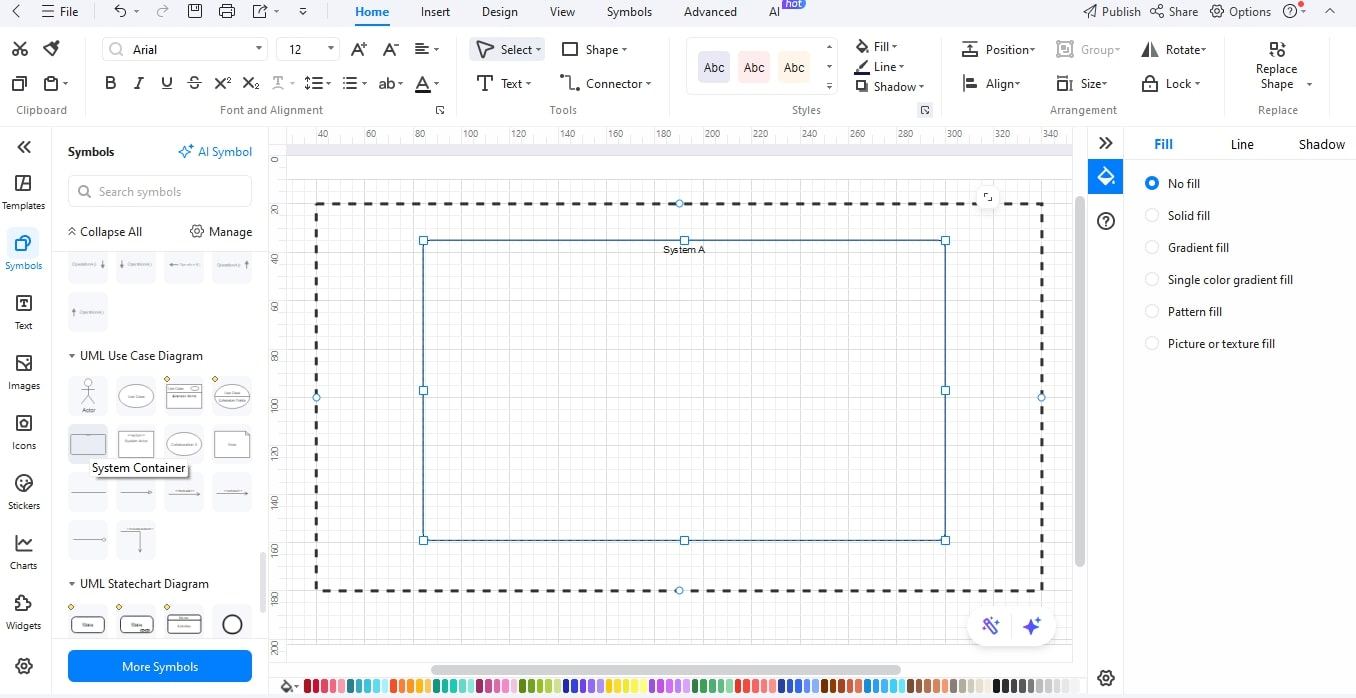
Step3 State the System Boundary
- Draw a big rectangle in the centre.
- Name it with the name of your system.
- Include a small scope subtitle (e.g., Handles orders for store).
Step4 Insert the Central System Box
- Put a box at the centre of the boundary.
- Insert the type Script Software System before the name.
- Below the name, put in a one-line description of purpose.
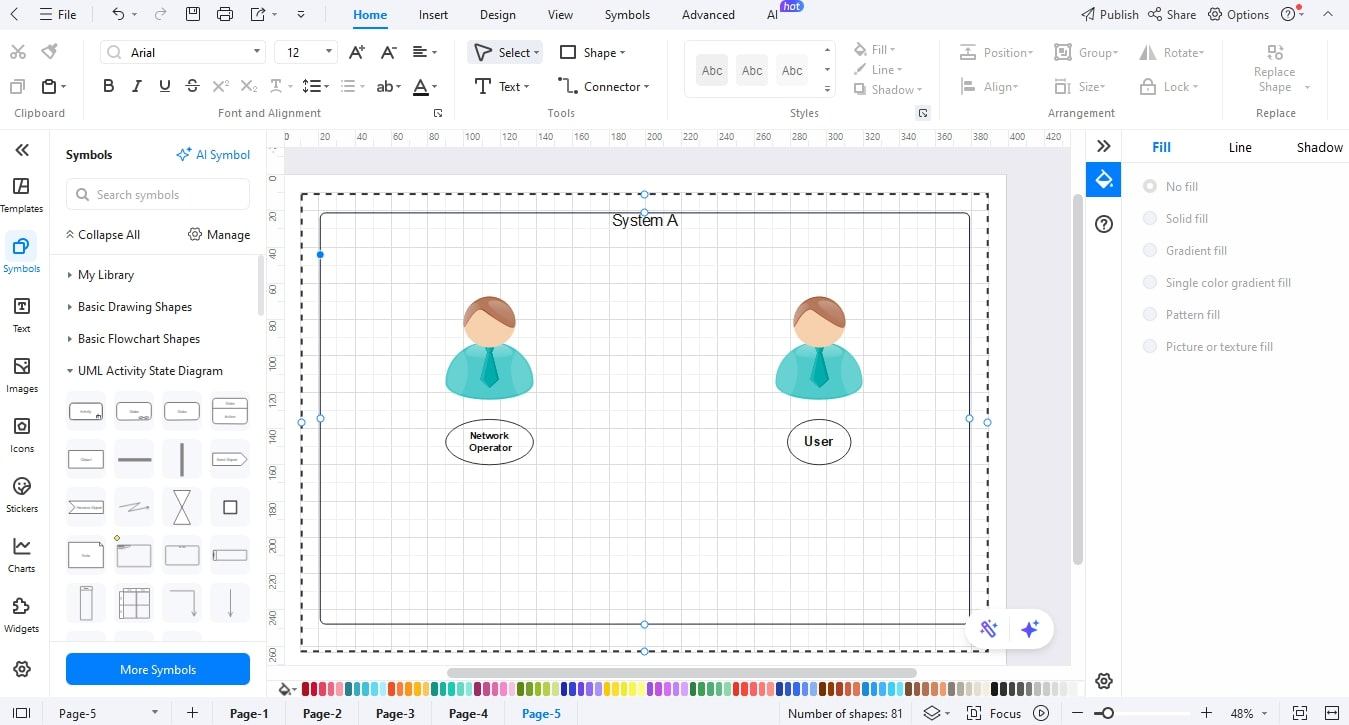
Step5 Add External Systems and Actors
- User drag icons (Customer, Admin).
- Add boxes to external systems (Payment Gateway, ERP).
- Take them outside the boundary of the central box.
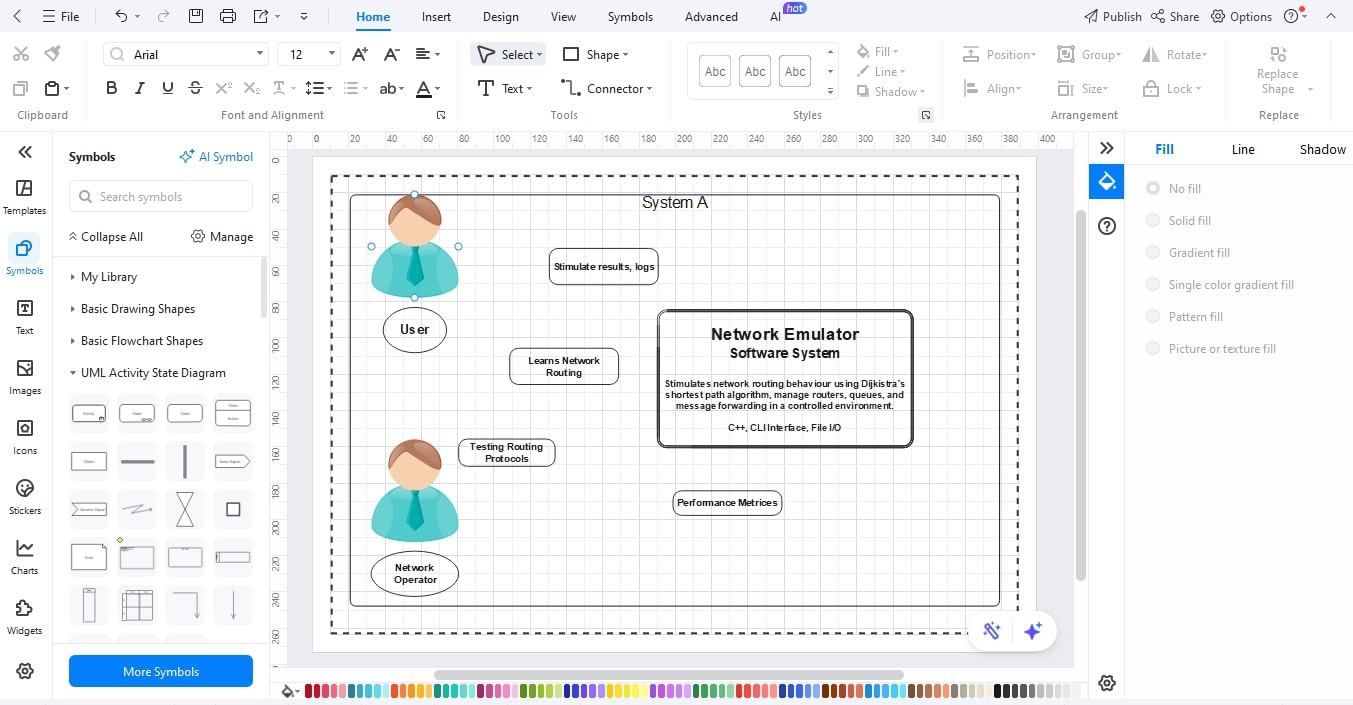
Step6 Relate Interaction Lines and Label Flows
- Draw arrows with the connector tool between actors/external systems and the central system.
- Name every arrow using plain text (e.g., Submit order, Validate payment).
- Solid arrows in requests and dashed in events.
Step7 Insert Legend, Title, and Scope Note
- Add a title at the top.
- Include a little legend of arrow styles and shapes.
- Include a brief scope note (one line) to demarcate the environment.
Step8 Style, Review, and Export
- Arrange things, make everything the same color, and correct overlaps.
- Check with a colleague and clarify labels.
- After that, you can save and export your diagram in JPG, PNG, SVG, or PDF.
Applications of C4 Context Diagram
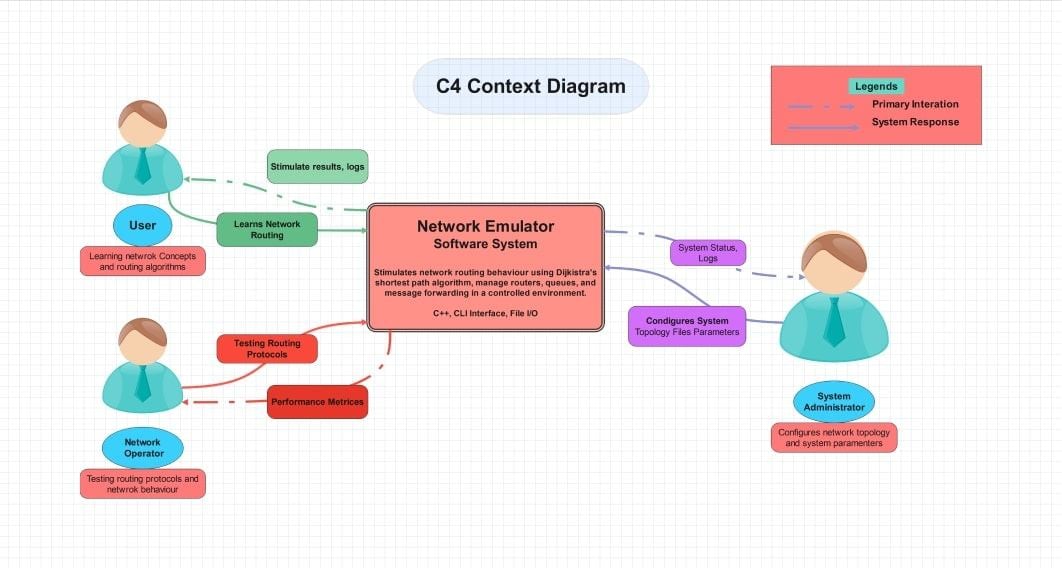
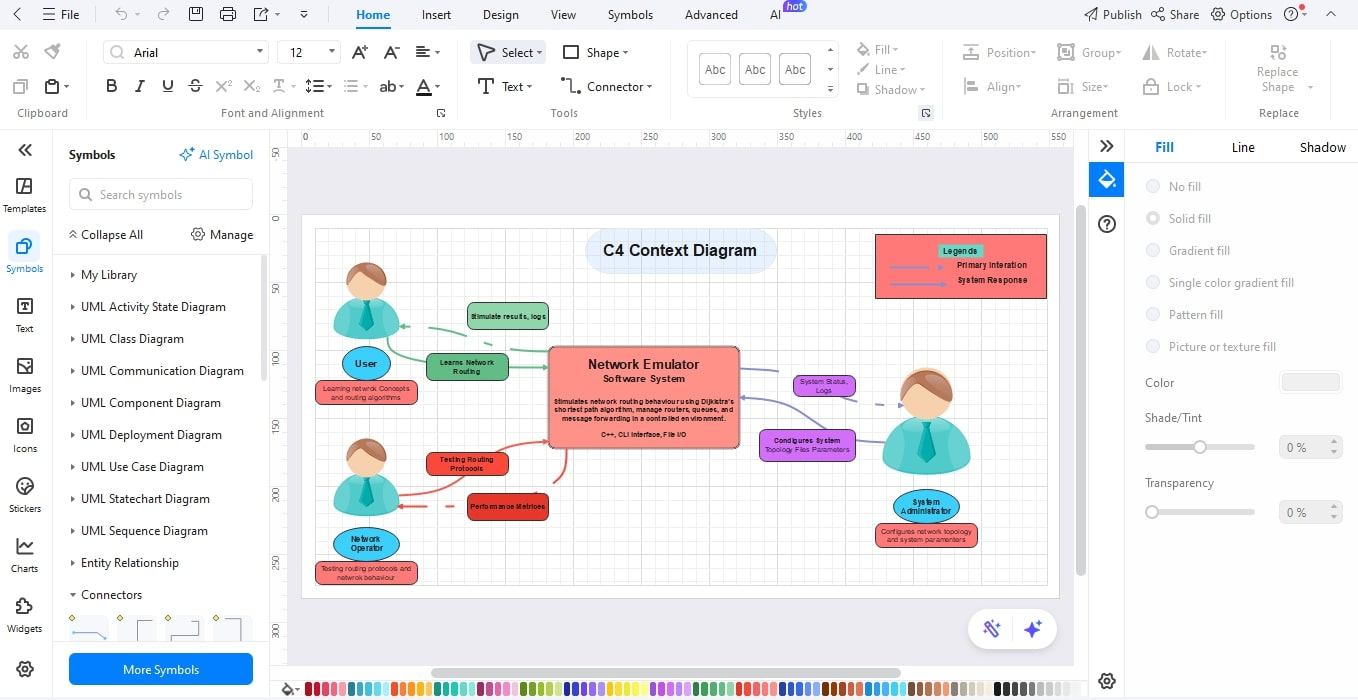
One real-life implementation of a C4 Context Diagram is the Network Emulator Software System illustrated above. This figure represents the interaction between various external users and systems, as well as a network-emulation platform used to test routing behaviors.
The main component is the Network Emulator that emulates routing behavior based on the shortest path algorithm by Dijkstra, operates routers and queues, and routes messages in a controlled setting. Three important external entities surround this core system:
- User
The user studies network concepts and routing algorithms. They communicate with the emulator in order to see stimulated outputs and logs, which provide information on routing processes. - Network Operator
Verifies routing protocols and observes performance measurements. They are mainly concerned with network behavior evaluation and making sure that their emulator is a good reflection of the real-world routing. - System Administrator
Prepares the network topology and system parameters. They submit important input files and are informed about the status of the system to maintain and optimize.
The diagram is very clear in differentiating between primary interactions (green and red lines) and system responses (dashed blue lines). This is a higher level of visualization. All the stakeholders can see data flows, responsibilities, and dependencies in a quick manner without going into internal code or architecture.
Conclusion
The C4 Context Diagram provides a high-level, clear picture of any system and its interactions with the outside world. It allows teams and stakeholders to know how a system fits into its larger environment without necessarily looking into the internal components or code by defining users, external systems, and primary data flows.
With the help of EdrawMax, it becomes easy to create these diagrams, and it guarantees uniform documentation and collaboration. A well-designed C4 Context Diagram, be it a network emulator, a web application, or a complex enterprise platform, enhances communication, simplifies development, and gives a solid base to future scaling or system improvement.
AI Diagram Generator
Enter your prompt. Upload files if needed. Generate diagrams, charts, or slides instantly.


