




A Gantt chart format is the visual structure that connects a task list with a time scale. At minimum, it shows what needs to happen and when; more detailed formats can also show owners, milestones, dependencies, progress, baselines, or critical tasks.
The right format depends on the project. A short individual project may only need tasks and dates, while a cross-functional launch may need dependencies, owners, milestones, and progress tracking. Adding every possible field usually makes a Gantt chart harder—not easier—to read.
This guide explains the core parts of a Gantt chart, how common formats differ by project type, and how to choose a level of detail that matches the decisions your team actually needs to make.
In this article
Quick answer: Every Gantt chart needs a task list and timeline. Add dates and duration next; then add owners, milestones, dependencies, and progress only when they help explain sequence, responsibility, or status.
What Is a Gantt Chart Format?
A Gantt chart format combines two views of the same plan: a structured task list and a time-based display. The task list explains what the work is; the bars explain when it happens and how long it lasts.
Task List, Timeline, and Horizontal Bars
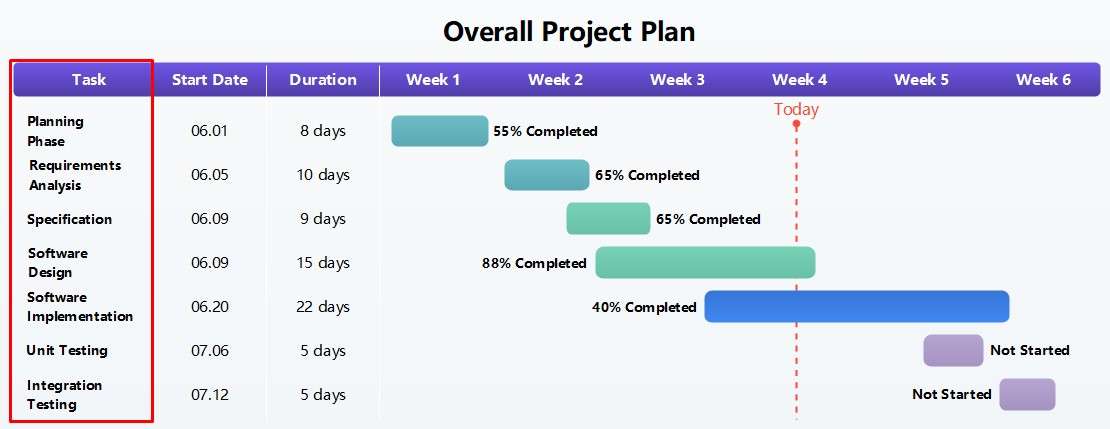
A task list is a vertical line that shows all the tasks and activities required to complete the project. It is the foundation of your Gantt chart and is positioned on the left of the chart. Project managers divide this list into phases and deliverables.
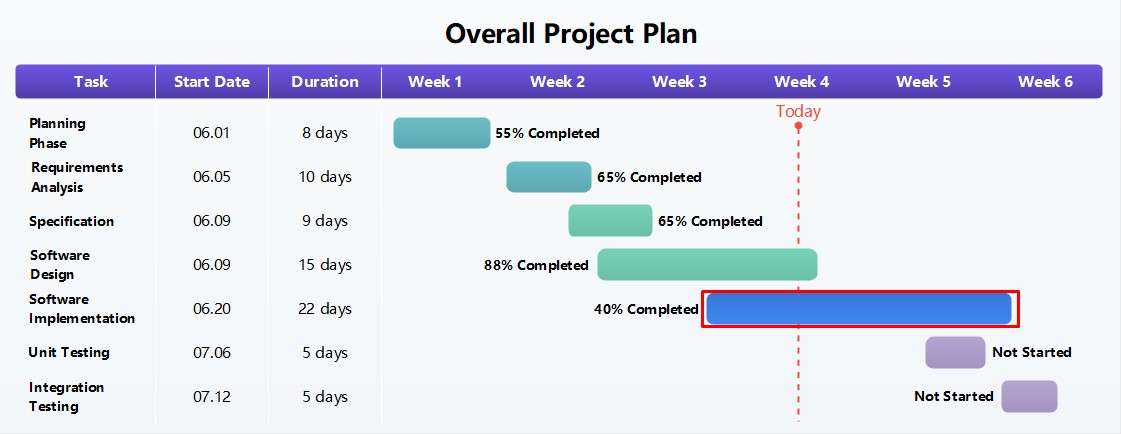
After task lists, there are task bars. These are horizontal markers for each task. An individual marker has task data, including a starting point, a stopping point, and duration. Often, project managers color-code task bars to differentiate tasks and see how long each activity takes.
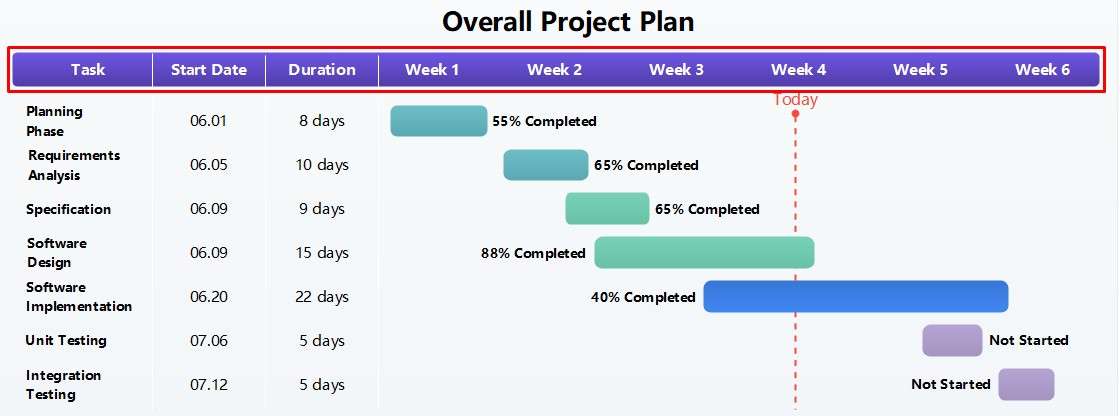
Next comes the project timeline. Located at the top of the chart, it is a horizontal representation of the project schedule, from start to the end date. The timeline gives the managers and team members a clear view of the task sequences and their durations. With this, the team can also spot potential bottlenecks and make adjustments to save time and meet deadlines.
Start Dates, End Dates, Duration, and Owners
Besides task bars and timelines, a Gantt chart has three data points: start date, end date, and duration. When combined, these data points convey information about the status and length of an individual task. Let’s break down each.
Start Date - the exact date an activity begins.
End Date - the exact date an activity is scheduled to finish.
Duration - the total span of working time between the start and end date.
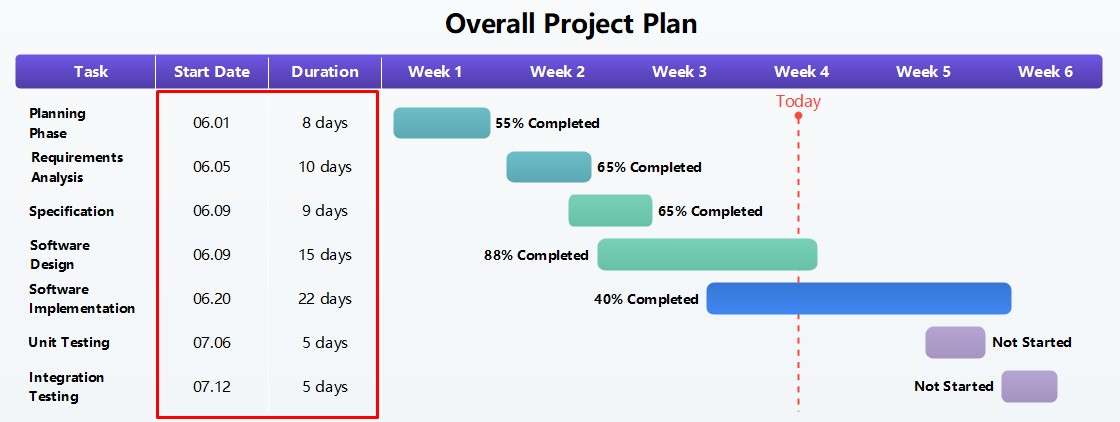
Then came the owners. Owners in a Gantt chart are the people, project managers, product owners, and teams responsible for assigning tasks and tracking progress throughout. These people/groups are directly accountable for completing milestones and meeting deadlines.
Do not confuse owners with resources. Remember, resources are the tools and other helpers you may get on board to finish the work on time.
Milestones, Dependencies, and Progress Tracking
Now that we’ve set up the basic components of the Gantt chart format, it is time to include details.
First come milestones. Represented by diamonds, these are special markers on the timeline that indicate major progress on deliverables or completion of a project phase. Think of them as checkpoints project managers use to visualize progress.
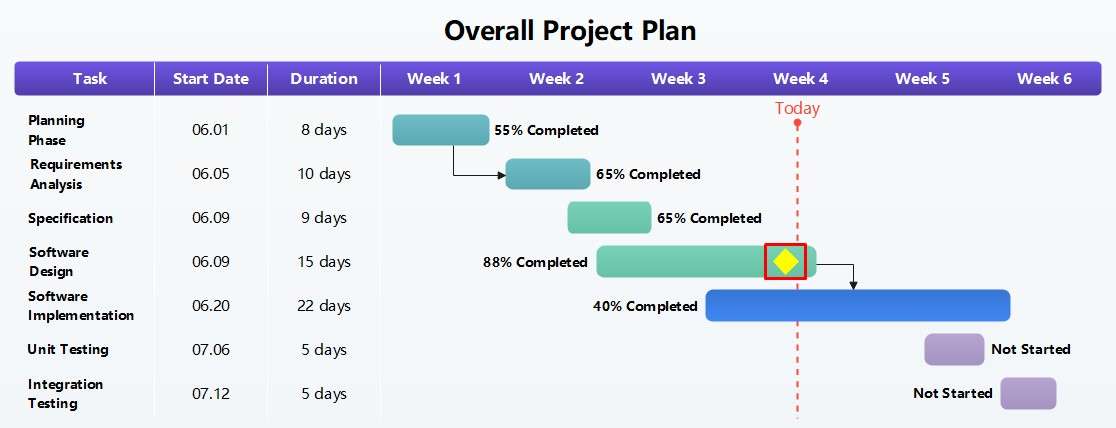
The second is task dependencies. These dependencies show how tasks relate and impact your task dates. Arrows linking task bars on the timeline show these dependencies.

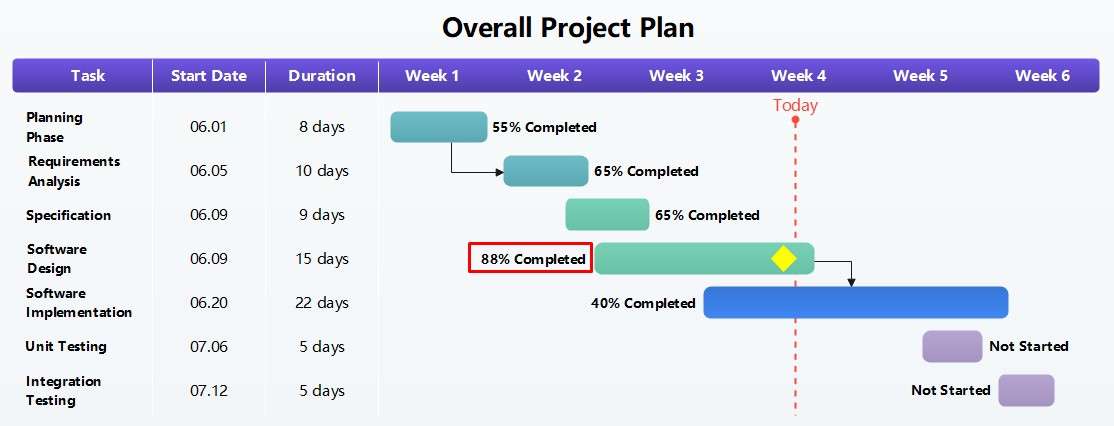
Then comes progress tracking. There are several ways project managers use to track their performance, including progress bars and a project baseline.
A project baseline is a copy of the original project plan for managers to compare actual progress to the one they projected. This baseline sits beneath your task bars as a visual reference. Moreover, a progress bar shows a percentage of task completion. This bar is located in front of the task information.
Essential Parts of a Gantt Chart
Now that we’ve covered the basic Gantt chart format, let’s understand some foundational parts every Gantt chart has.
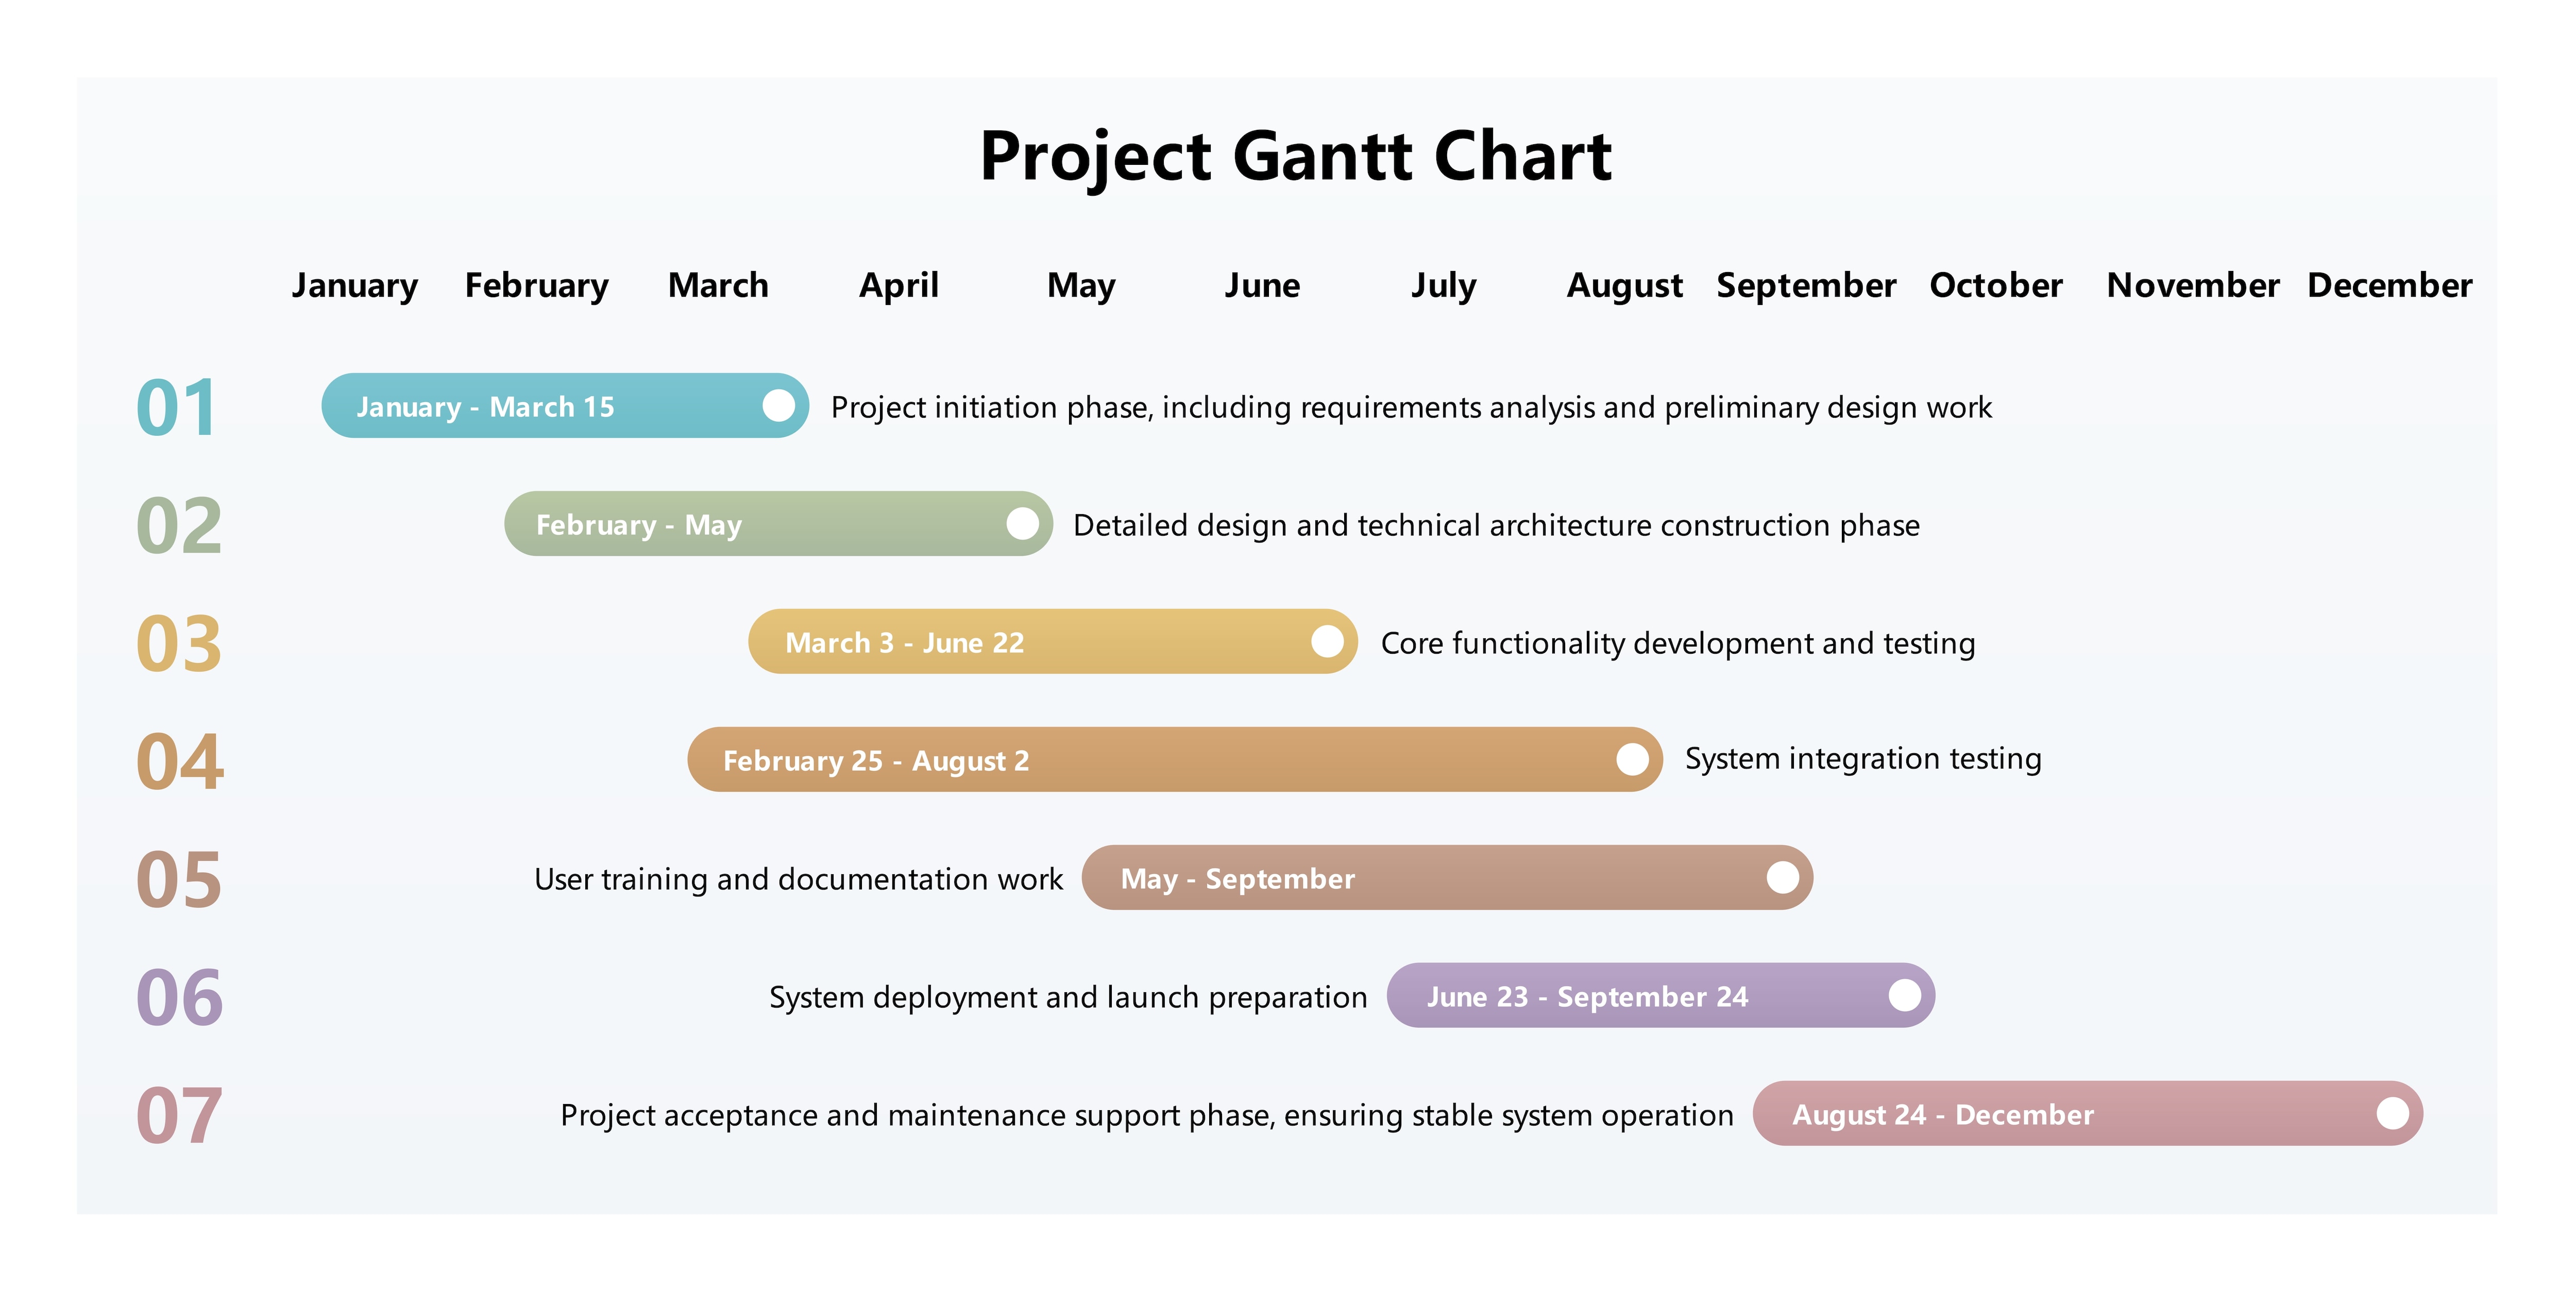
Gantt chart components example


Work Breakdown Structure and Task Names
The core focus of a Gantt chart is to break down the tasks into groups and sub-groups. Technically, it is known as Work Breakdown Structure or WBS. Common WBS elements in a Gantt chart include:
Deliverables are products the team is trying to produce. It could be an app, user manual, testing report, website launch, and so on.
Task Lists/ Groups consist of tasks and sub-tasks that make up the entire project. Imagine you are designing a Gantt chart for website development. Within this chart, one group of tasks is Design, and a sub-group for this is Create an About Us Page.
Task Names are task descriptions project managers use for the team to quickly identify them.
Due Dates are the start and end points of a task for the team to track progress and compare actual vs. projected dates.
Task Priorities are essential tasks the project manager must focus their resources and attention on.
Load and Lag are additional components in your Gantt chart used to represent flexibility in sequencing tasks. Load is the time a successor task can start before its predecessor task is completed, facilitating overlap. Lag represents the time that must be allocated between the predecessor task and the start of the successor task.
Task Owners are people responsible for assigning duties among team members.
Resources are tools, equipment, supplies, and individuals assigned for specific tasks to speed up the project and meet deadlines.
Remember, your WBS Gantt charts may not require all such elements. A simple project may require only a basic list of major tasks and no sub-tasks, loads, and lags.
Timeline Scale: Daily, Weekly, Monthly, or Quarterly
A timeline is your project schedule represented visually. Spanned out on the horizontal axis, the timeline scale breaks down your entire project schedule in daily, weekly, and monthly activities. With this, the team can better visualize how to progress toward the goals and deliverables.
The question is, how to decide which timeline scale to use?
It all comes down to your project’s complexity and length. For instance, daily views work best for shorter, fast-moving projects where tasks change instantly and accuracy matters. In comparison, weekly and monthly timeline scales are better suited for projects with task overlapping and situations where micro-tracking seems unnecessary.
Whatever the scale of your timeline, a typical one has the following components.
Time Labels are the time increments, such as hours, days, weeks, months, and even quarters.
Start and End Points are the absolute beginning and deadline of the entire project. Do not confuse them with task dates.
Current Marker or Dateline shows your current status in a vertical line.
Milestones are special targets project managers include in longer plans to indicate key target dates.
Progress Bars and Percent Complete
A project bar shows you progress: how complete the project or individual task is. Project managers use this bar to update a task’s percentage of completion. With this, it’s easier to flag delayed activities and tasks that are ahead of schedule so that teams can adjust accordingly. Progress bars can be color-coded or shaded, depending on different styles.
Dependencies, Critical Tasks, and Project Risks
Longer and complex projects demand careful planning and constant updates. This is why Gantt charts have elements to identify crucial tasks, spot potential bottlenecks, and avoid risks. Let’s discuss them in detail.
The critical path is the longest task sequence in the Gantt chart that a team must address early to make sure the plan finishes by the due date. This path shows tasks and their dependencies. This way, it’s easier to determine the earliest time for your team to reach the delivery date.
Next come dependencies. In a Gantt chart, some tasks are dependent on others. They can’t begin until their predecessors are finished or completed to some percentage. These are dependencies. Dependencies give you a clear view of
How are tasks related?
Which tasks need to be completed before the next task?
What is the order of operations?
While planning projects that take months or even a year, you must be mindful of the risks that may arise during implementation. This could be setting unrealistic deadlines, budget overruns, resource shortages, and so on. Here are a few ways you can manage such risks in a Gantt chart.
Identify the critical path.
Add buffer times (extra days before all major milestones for flexibility).
Color-code high-risk tasks for immediate attention.
Constantly update the Gantt timeline.
Common Gantt Chart Formats by Project Type
Every project on a Gantt chart looks different. For instance, a marketing campaign focuses on task dependencies, while a software development plan favors a weekly timeline scale and formal deliverable-focused structure. Here are a few common Gantt charts by project type, so you know what to include when.
Construction Schedule Format
A construction schedule Gantt chart visually maps a project timeline using horizontal bars. The focus of this format is plotting task sequences and dependencies, since most activities rely on those before them. Like a regular Gantt Chart format, a construction schedule includes milestone markers, task lists, task bars, and dependencies.
In a construction schedule, delays are natural. This is why a Gantt chart involves potential risks, such as critical paths, buffer times, color-coded progress bars, and task priorities.
Marketing Campaign Calendar Format
Marketing campaigns involve using multiple channels, building various assets, and producing deliverables under tight deadlines. As they are inherently complex, their Gantt chart formats demand clarity and organization. Hence, it’s better to avoid micromanagement and opt for weekly or monthly timelines.
Besides this, such a format also favors key milestones, dates, and sub-task labels. Also, marketing campaigns run on performance reviews and constant approvals. This is why it’s always a better choice to include a progress bar or project baseline.
Software Release Plan Format
A software release Gantt chart visually projects the work breakdown structure, from development to deployment. As it is a process-based project, the chart focuses on dividing the tasks into phases. A few common phases in a software release Gantt chart format include
Requirement Phase involves collecting user needs for technical feasibility.
Design Phase is when the architects produce the blueprint for the system.
Development Phase involves engineers building the frontend and backend setups.
Testing Phase checks whether the created system is functional and user-friendly.
Release Phase is the final stage in which the team launches the software.
In such a format, task dependencies also matter, as the development and testing phases are inter-connected. Moreover, as the project is fast-to-medium paced, the software release Gantt chart typically follows a daily or weekly timeline.
Student Project Timeline Format
Student project Gantt charts lean toward a straightforward format, often revolving around an individual or a small group. These formats have generic task lists, basic task names, and a daily or weekly timeline scale. Even if the tasks are interconnected, student projects involve two levels of work breakdown structure.
How Do You Choose the Right Gantt Chart Format?
Choose the format by the decisions the chart must support. If the audience only needs timing, keep it simple. If the team coordinates handoffs, add dependencies and owners. If leadership tracks delivery, add milestones and progress without turning the chart into a database.
Simple Timeline vs Full Project Schedule
Before you jump into documenting the project, it’s important to address that not all projects demand a Gantt chart. Sometimes, a basic timeline or task-based checklists are all you need to manage fast-paced tasks with no strict dependencies.
Whereas a project schedule focuses on complex work breakdown structures. These Gantt charts document the timeline, including the tasks, deadlines, dependencies, and activities. Hence, it’s better for overlapping projects like software testing and marketing campaigns.
Small Team Projects vs Multi-Department Projects
The right Gantt chart format also depends on the project scale. For instance, lightweight charts are a better fit for smaller teams handling fast-paced projects, such as online launches, social media management, and so on. In such projects, the manager does not have to formalize labels, as long as the timeline is sorted and organized.
Multi-department projects like a software launch are completely different. For these projects, you have to engage stakeholders with clearly defined deliverables, formal deadlines, key milestones, and overlapping tasks. Hence, this should reflect in your Gantt chart as well.
When to Add Dependencies and Resource Owners
We’ve already established: not all Gantt charts have dependencies. They only become useful if tasks rely on each other to progress.
Imagine a software launch. It is a multi-departmental project and has a complex work breakdown structure. The development tasks directly affect the testing ones. Testing can’t begin until the code is in place. Hence, clear relationship status and timelines can benefit the team.
The same goes for owners. Once the dependencies are established, the task owners can estimate resource requirements and assign duties. This way, they can also avoid bottlenecks, such as assigning resources to a person before their predecessor has completed their task.
Free Gantt Chart Format Templates
Check out these Gantt chart format examples and understand how each component plays its part in the whole project schedule.
Blank Gantt Chart Format
blank Gantt chart format
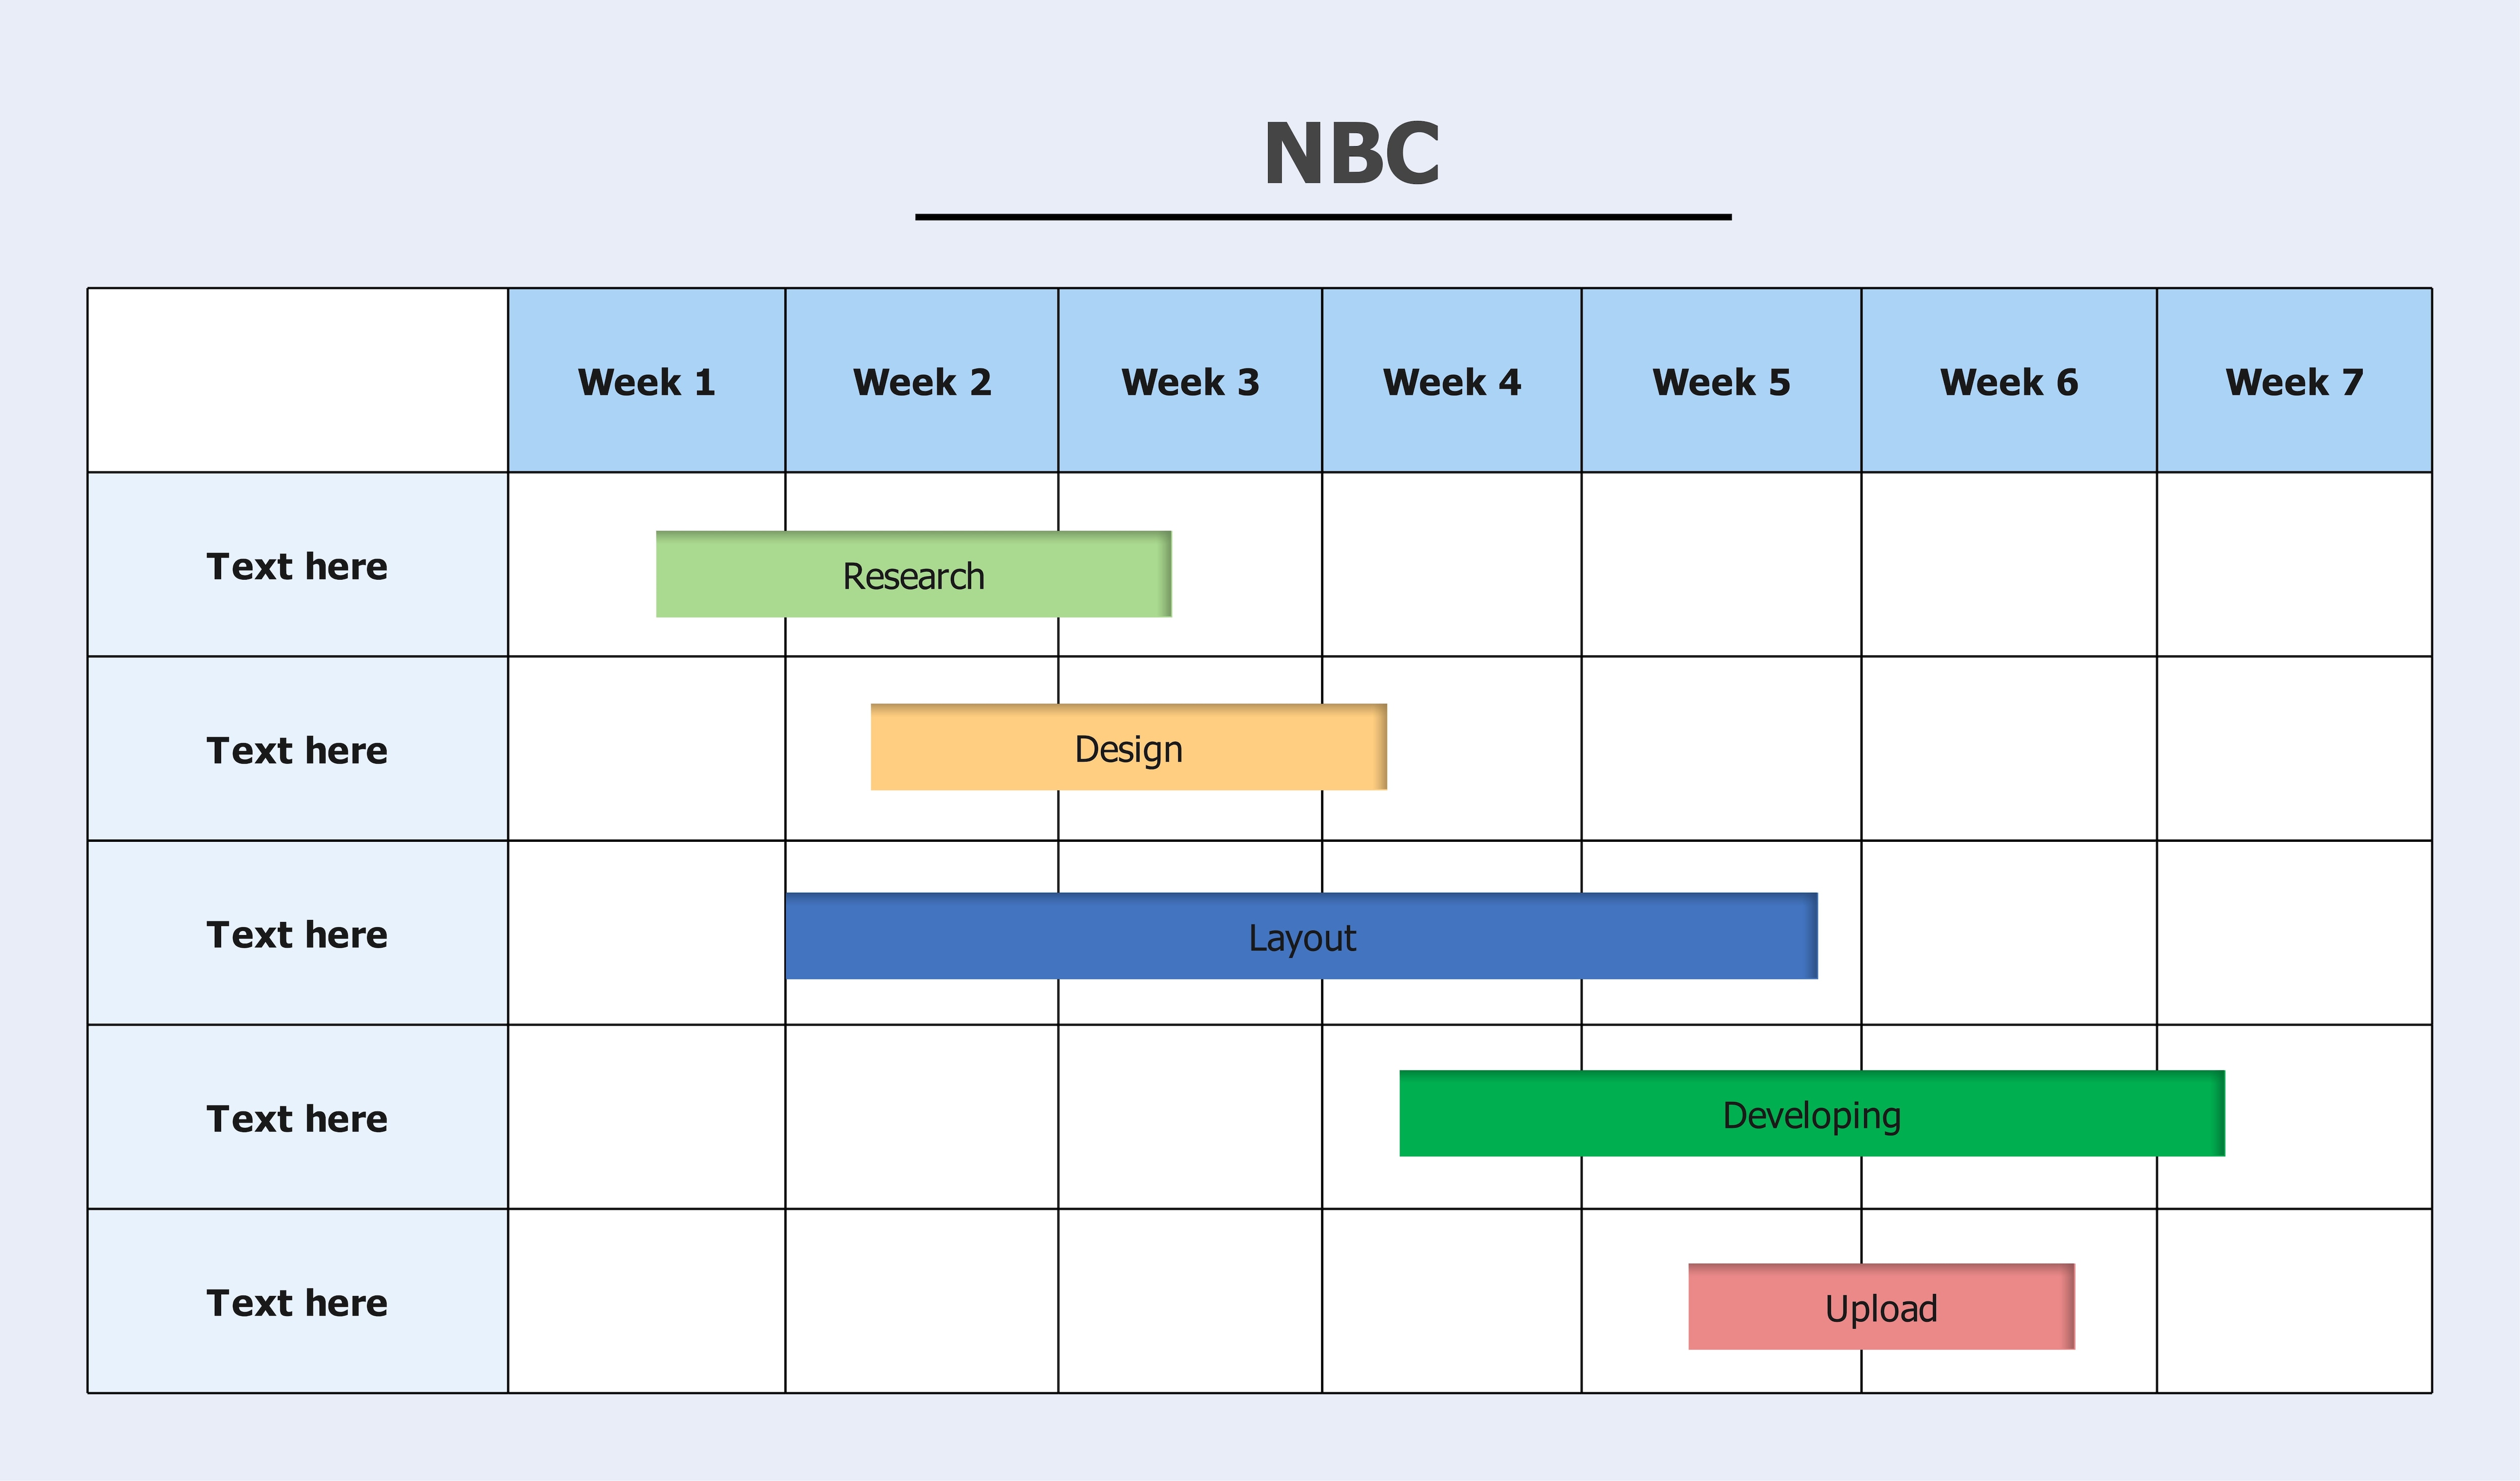
This example shows a Gantt chart format in Excel with a seven-week timeline and a basic task list. You can treat it as a simple framework for organizing a fast-paced, small-sized project, such as a study plan or social media postings. Moreover, a horizontal task bar shows which activity takes place and when. It’s a great way to practice your Gantt chart and include essential elements, such as milestones, task dates, duration, and so on.
Project Management Gantt Chart Template
project management Gantt chart format
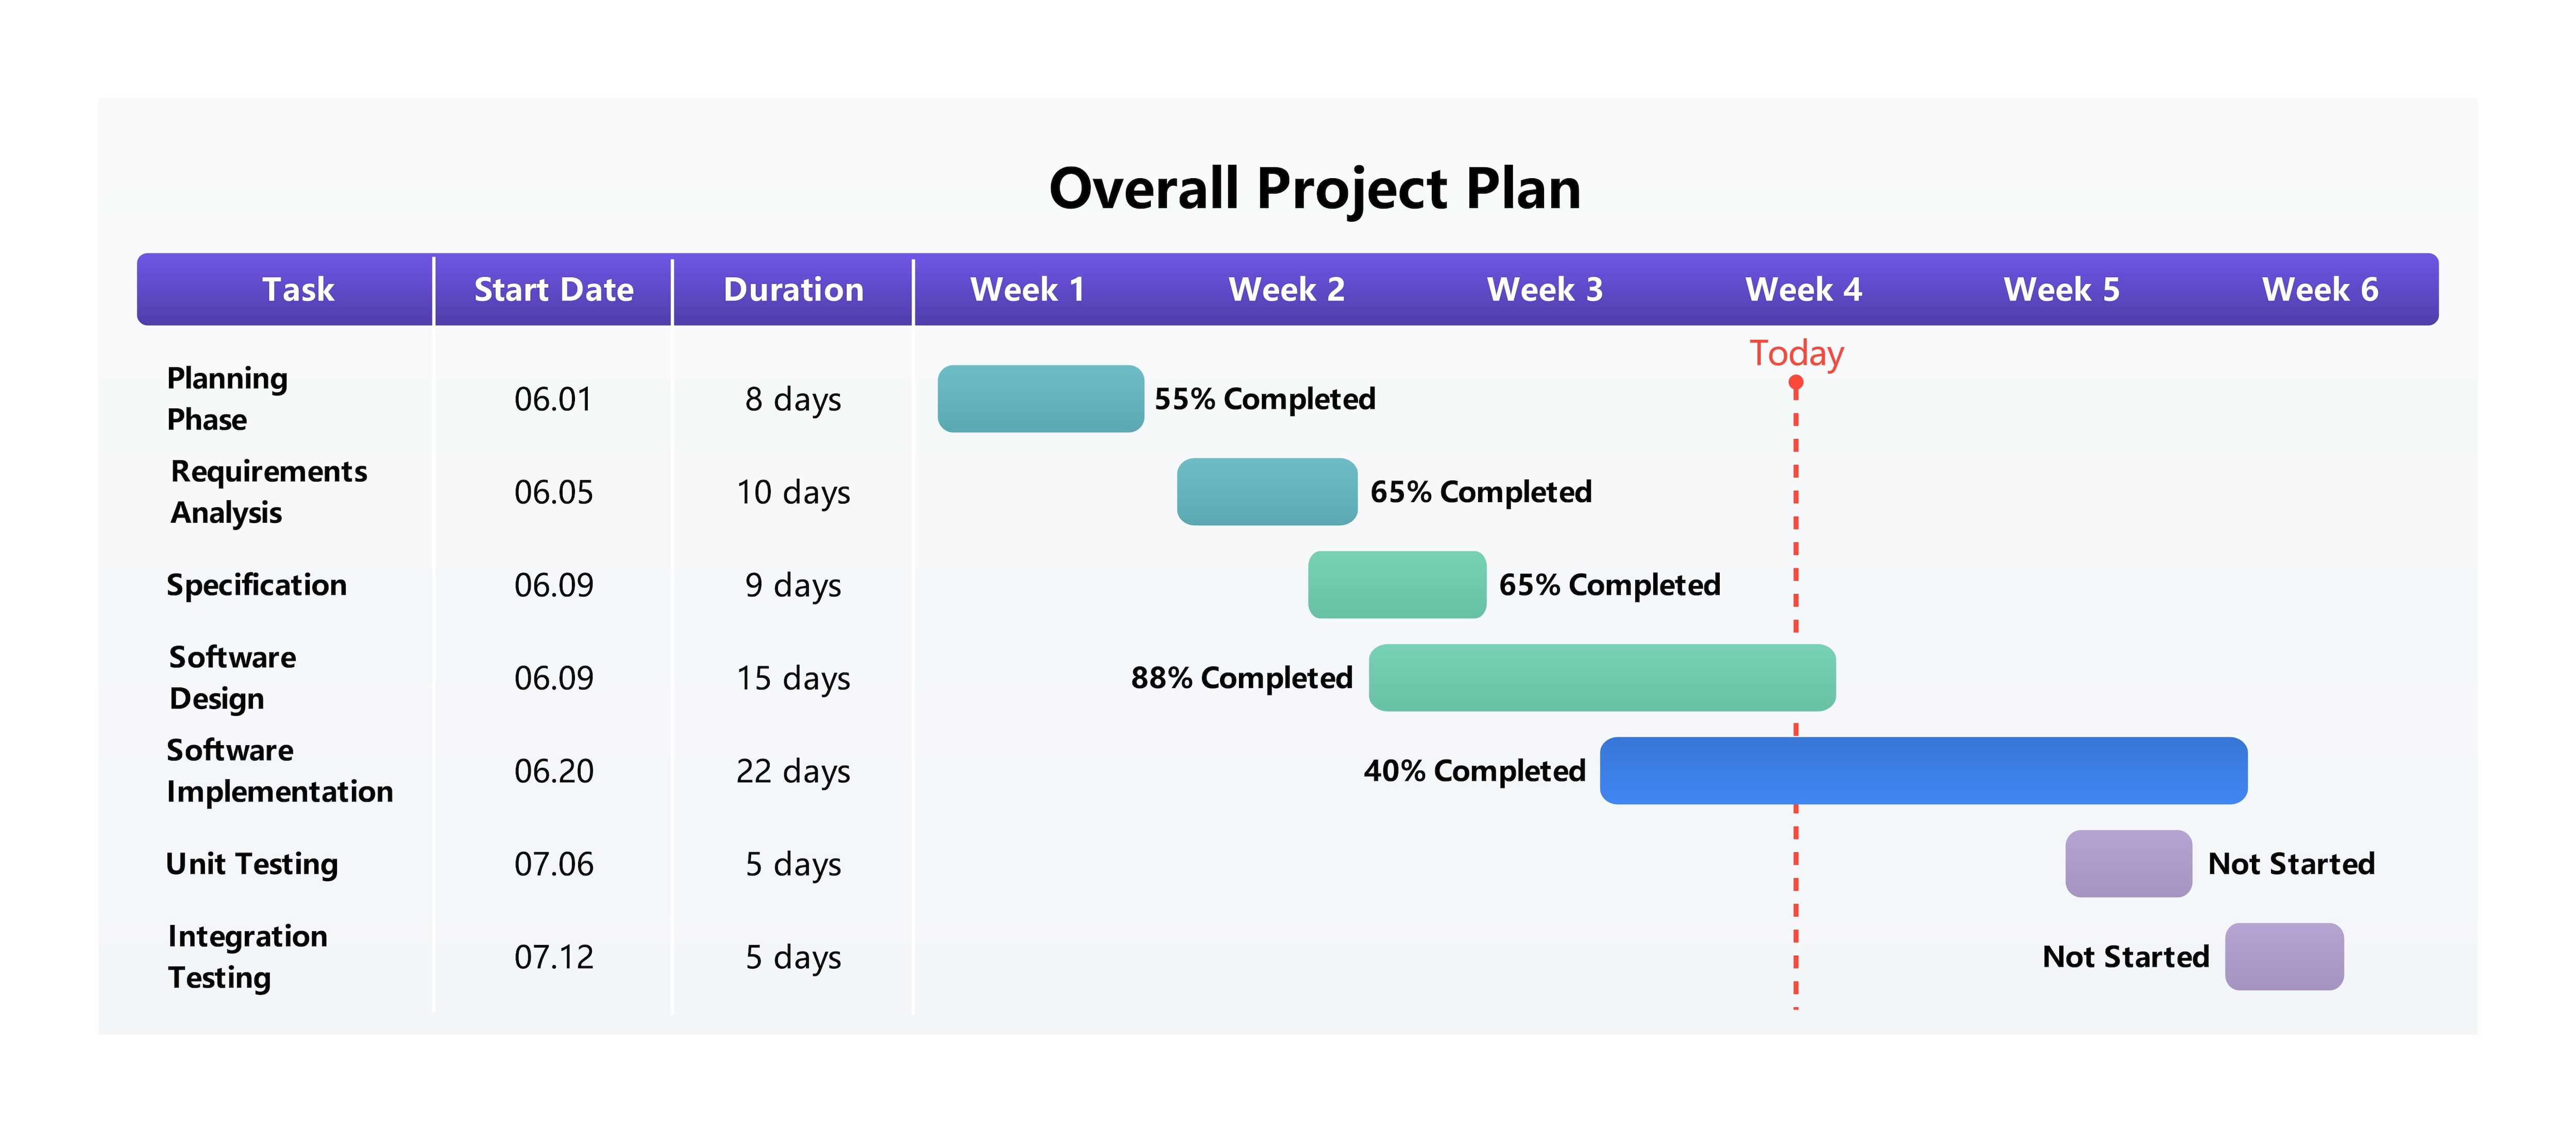
This project management Gantt chart example is a textbook visualization of this technique. It shows a task list on the left side, followed by due dates, durations, and task bars. All the horizontal task bars are color-coded and show progress percentage, giving you a clear overview of how the team is performing. Besides basic elements, this chart includes a vertical dotted line, representing the current point in the project.
Monthly and Weekly Gantt Chart Templates
project management Gantt chart format
This is a typical weekly timeline Gantt chart example, depicting a product launch. The project spans over five weeks, each following a basic WBS approach.
Each stage has a dedicated color-coded task bar, making it easy to see where the activity begins. The task bars include all the key information you need, including the owner, a short description of the work, and progress markers.
Wrapping Up!
A good Gantt chart format makes sequence and timing easier to understand. Start with tasks and a timeline, then add the minimum extra information required to coordinate the project. When a chart becomes crowded with fields that no one uses, simplify the format before adding more detail.
FAQs
What is the best Gantt chart format for a simple project?
For a simple project, use a task list plus start date, duration, and a weekly or daily timeline. Add an owner or progress field only if someone needs to act on that information. Avoid dependencies, baselines, and extra status fields unless they change how the project is managed.
What are the core elements of a Gantt chart?
The core elements are a task list, timeline, task bars, start and finish dates or duration, milestones, dependencies, owners when responsibility needs to be shown, and progress when status needs to be tracked. Not every chart needs every element.
What are the common mistakes when making a Gantt chart?
Some common mistakes when making a Gantt chart include not updating it regularly, overlooking the bottlenecks, setting unrealistic deadlines, and overcrowding the Gantt chart. These issues eventually result in delays.
When to use a Gantt chart?
A Gantt chart is a visual illustration of any project’s timeline. Product owners, marketers, social media managers, and project managers use these charts to plan events, schedule them, and track their progress throughout the project’s cycle.
When should a Gantt chart include dependencies and owners?
Add dependencies when one task cannot start or finish until another task reaches a specific point. Add owners when responsibility is shared across people or teams and the chart is used for coordination rather than personal planning.
AI Diagram Generator
Enter your prompt. Upload files if needed. Generate diagrams, charts, or slides instantly.



 (AI & Web)