


A circular process chart depicts a continuous sequence of steps in a circular flow. These diagrams are essential in project management by illustrating complex workflows. They enhance comprehension and facilitate efficient task monitoring. This article explores the significance of circular process diagrams in project management.
By the end of this page, you can create process circle diagrams in minutes. You can take advantage of ready-made templates at your disposal or create your own by following the guide below. Read the article to learn more.
In this article
Part I. What Are Circular Process Charts?
Circular Process Charts serve as potent tools for visualizing complex processes in project management. Below are its core components, types, use cases, and benefits.
Core Components
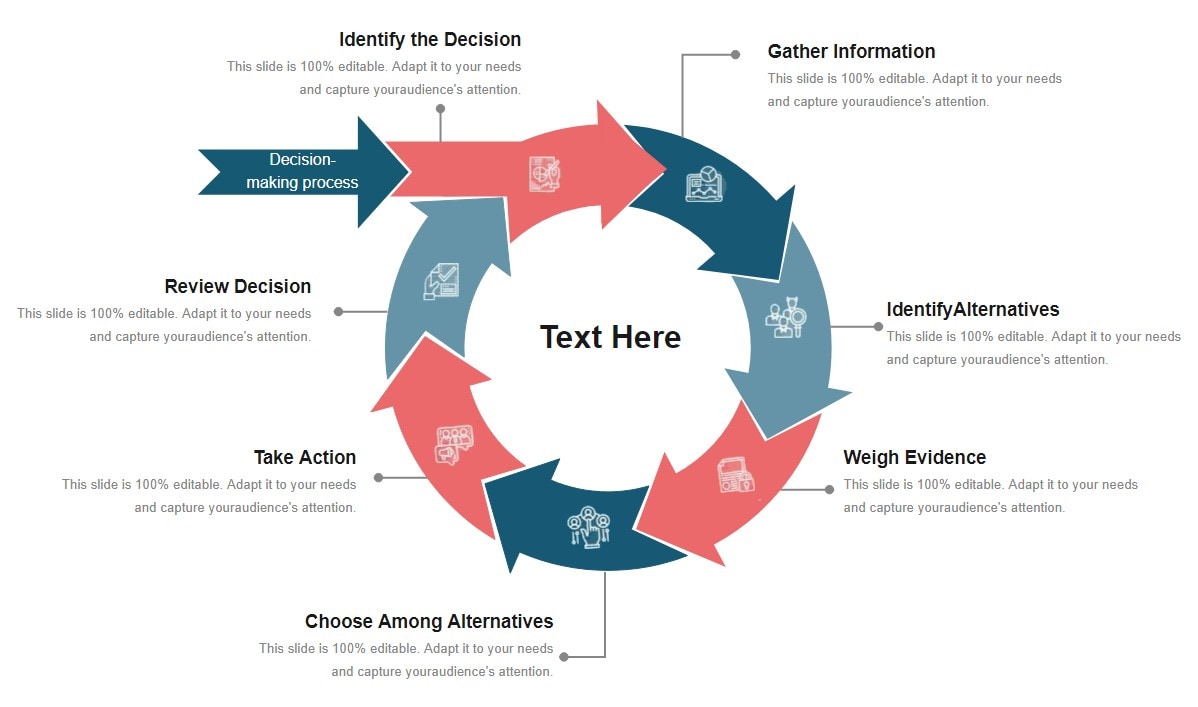
The components of a circular process chart include labeled steps, arrows, and a circular arrangement. The labels illustrate a sequence of interconnected steps in a circular flow. Arrows state the flow direction. Meanwhile, the circular arrangement symbolizes the cyclical nature of the process.
Different Types
There are two common types of circular process charts: a basic and a multi-layer circular chart. The basic circular chart represents a cycle of steps without intricate variations. Meanwhile, a multi-layer chart displays interconnected cycles within a larger circular structure. The latter is suitable for depicting complex processes.
Use Case and Benefits
Here are several use cases and benefits of using a circular process diagram.
- Project Management. Circular Process Charts are crucial in project management. They convey the sequence of tasks, aiding project teams in understanding the workflow.
- Workflow Clarification. These diagrams provide a clear visual overview of a process's cyclical nature. It reduces confusion and enhances comprehension.
- Efficient Communication. Circular Process Charts simplify the communication of intricate processes. This is beneficial to stakeholders, clients, or team members.
- Continuous Improvement. By visualizing the circular flow, it becomes easier to identify bottlenecks. You can check areas for optimization within the process.
- Training and Onboarding. New team members can grasp the workflow by referring to these diagrams. It can speed up their integration into the project.
Part II. 5 Circular Process Chart Examples
This section explores 5 examples of Circular Process Charts taken from Wondershare EdrawMax's Templates Community. These real-world templates demonstrate the applicability of these visual tools across various domains.
Example 1
This circular diagram illustrates the holistic ecosystem of brand communication. At its core lies Brand Culture. It's encompassed by three key pillars: Branding, Brand Design, and Brand Strategy. This diagram explains how brand culture influences and interacts with various communication elements. It aids strategic decision-making in brand development, presentation, and innovation.

 below.
  below.
Example 2
This diagram portrays the iterative service, product innovation, and upscaling process. The loop connects the service, product, and production stages. At its core, product-looping business models converge with virtual production and exchange models. This diagram aids companies in strategizing sustainable business models. It visualizes how innovative approaches can drive circular economy principles. It also shows how to enhance long-term profitability.

Example 3
This circular diagram illustrates inefficiencies among 100 respondents working 8 hours per week. It comprises five segments representing weekly hours from 0, 1-5, 6-10, 11-20, and 21-30 hours. The diagram Identifies time waste patterns, aiding resource optimization.

Example 4
This process circle diagram illustrates the flow from raw materials to consumers. It starts through suppliers, manufacturers, distributors, and retailers. The arrows represent logistics and demand flows. The diagram shows the comprehensive supply chain journey. It pinpoints potential bottlenecks and optimizes logistics. Using this diagram enhances demand forecasting for efficient resource allocation.

Example 5
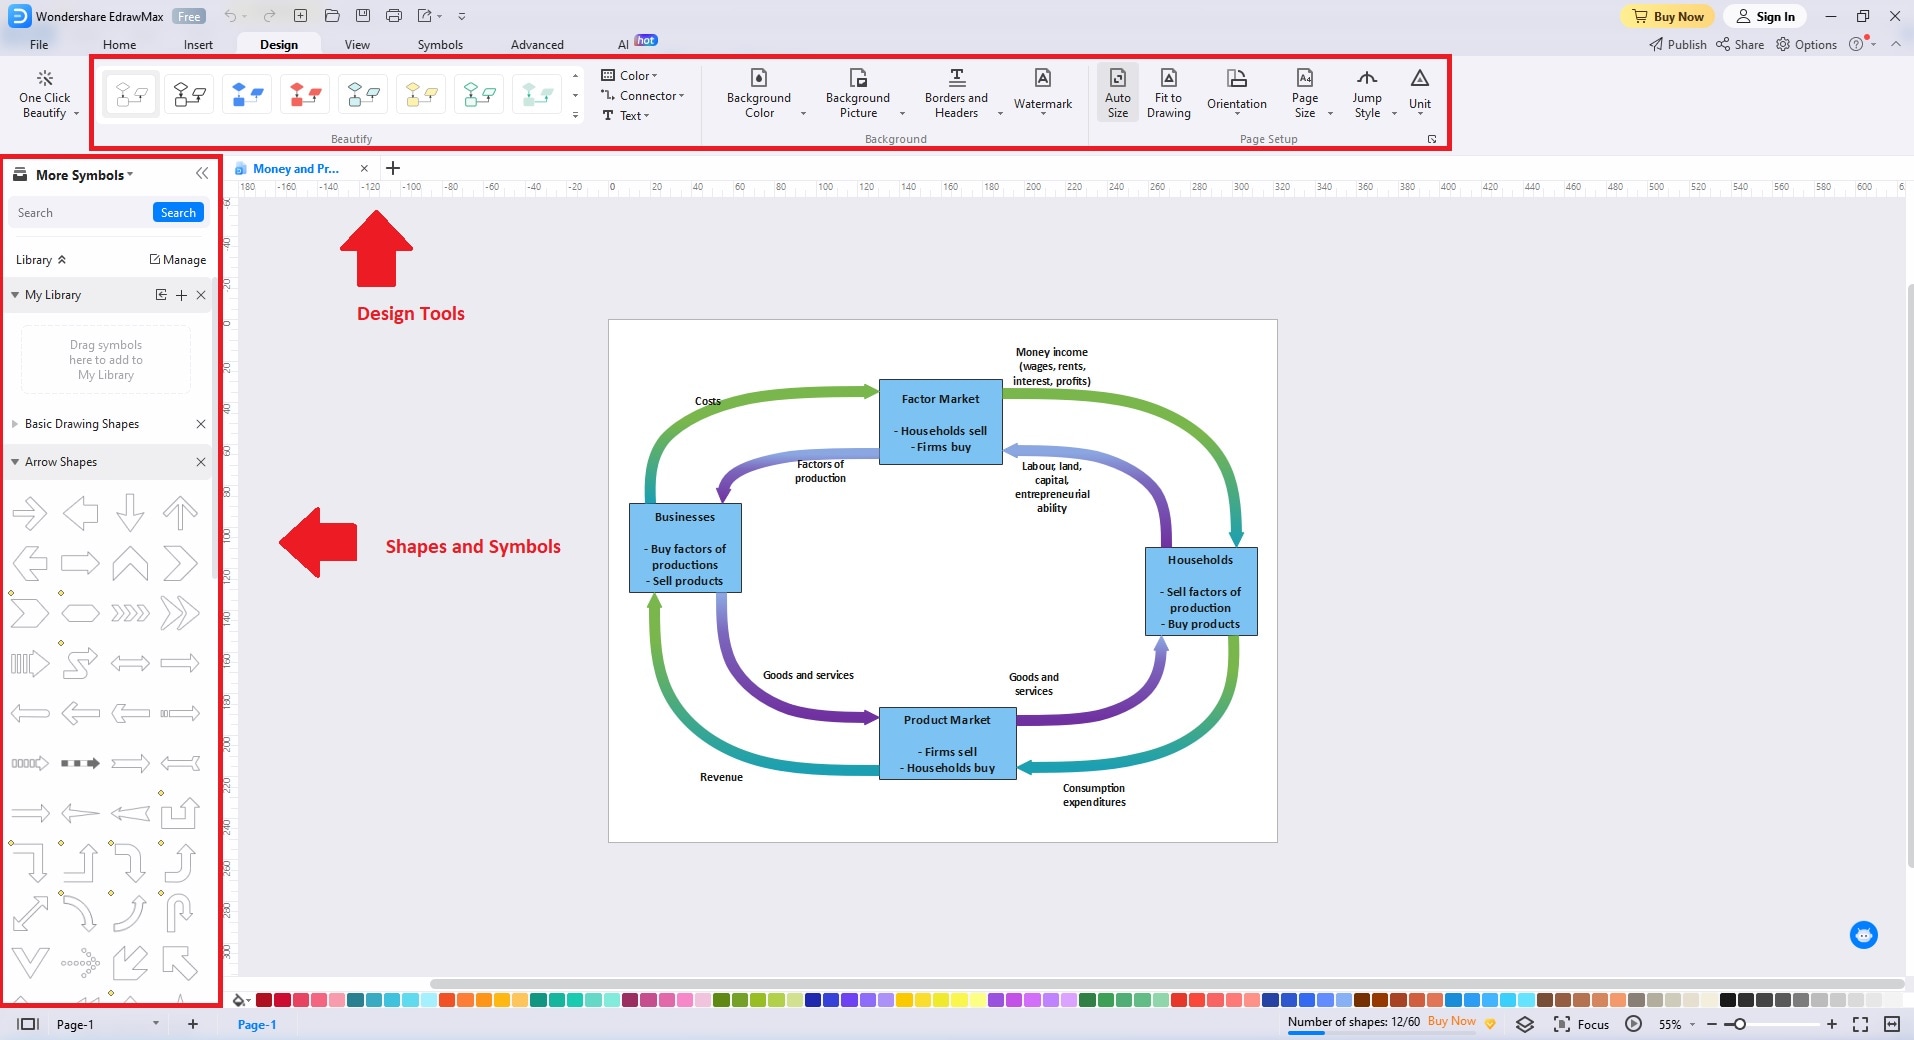
This diagram depicts the interaction among factor markets, households, product markets, and businesses. Internal arrows signify the flow of factors of production and goods/services. This includes labor, land, capital, and entrepreneurship. External arrows illustrate costs, money income, consumption expenditures, and revenue. This diagram clarifies economic exchanges. It aids analysis of resource allocation, income distribution, and market dynamics.

You can easily customize the templates above using Wondershare EdrawMax. The next section will outline the steps to create your unique circular process charts in minutes.
Part III. How To Create a Pie Chart in EdrawMax
Below are the steps to craft circular diagrams using Wondershare EdrawMax.
Step1
Download EdrawMax or try it online for free. Log in with your Wondershare ID or an account of Google, Facebook, or Twitter.
Step2
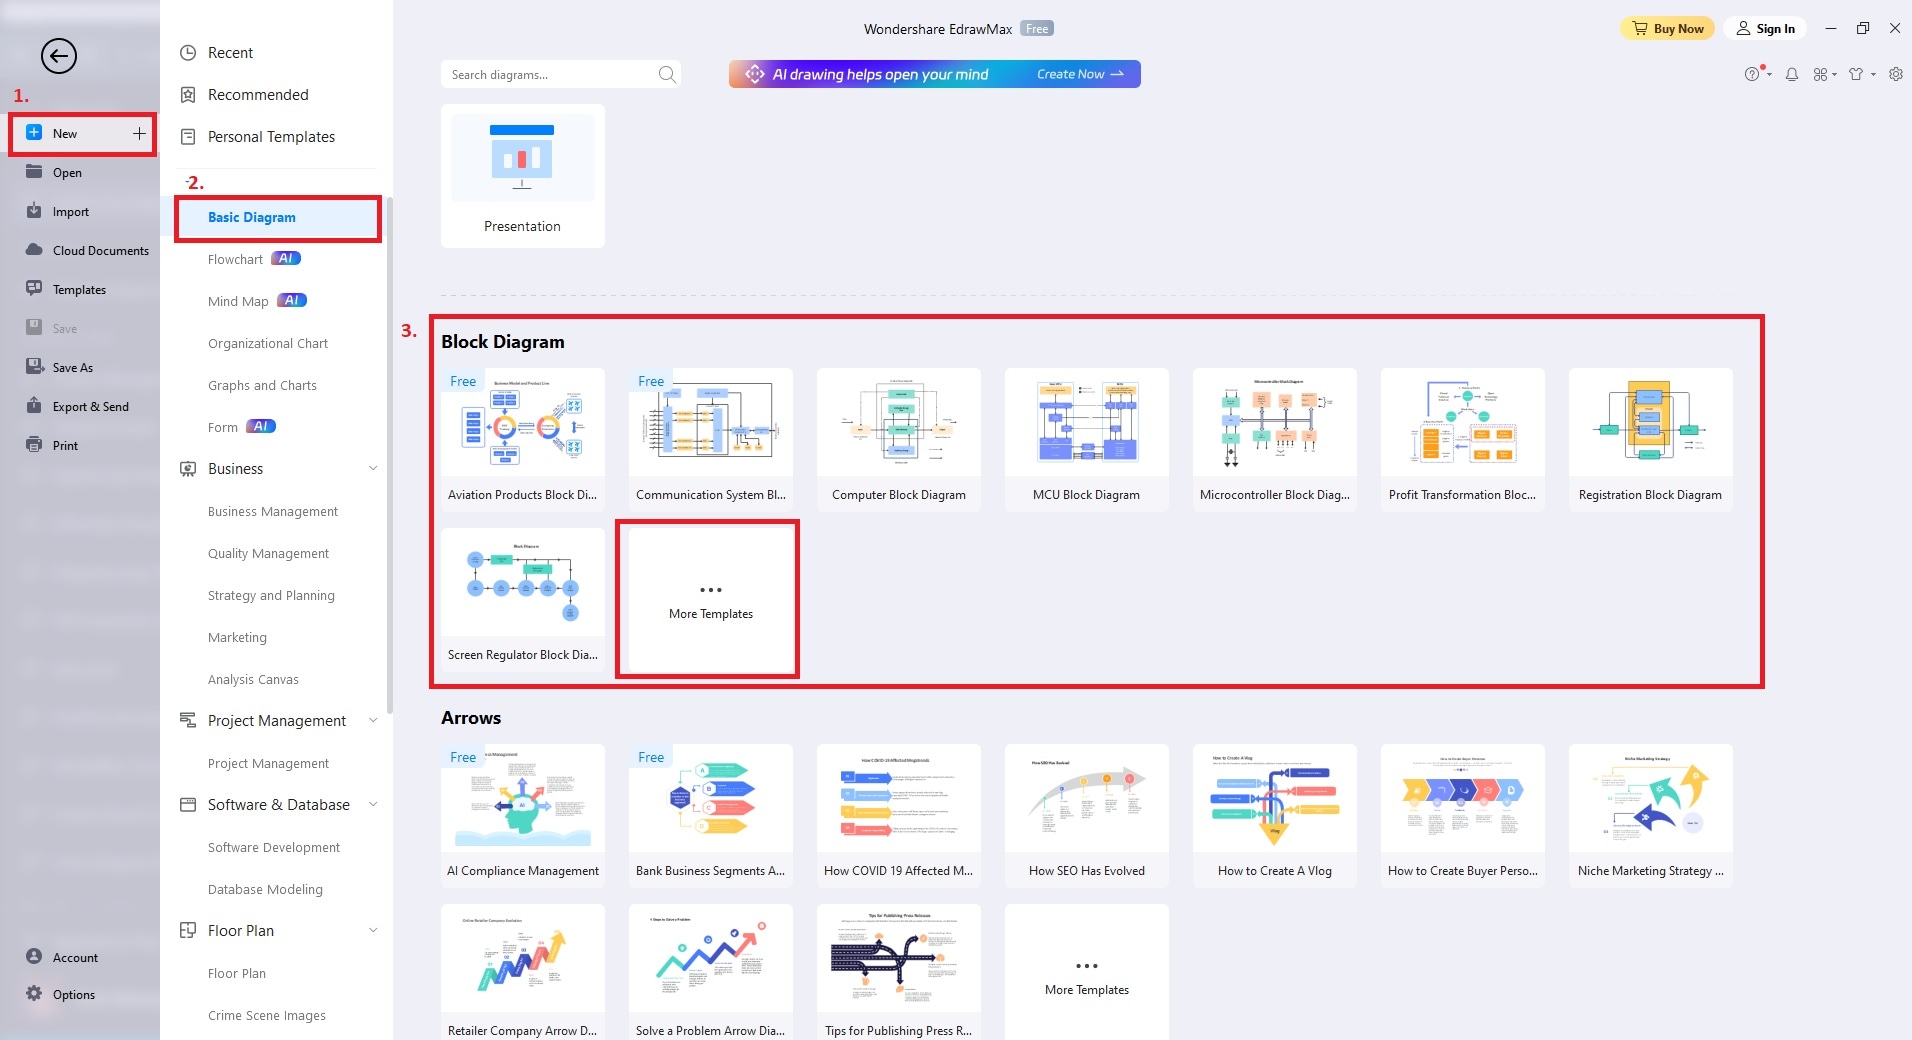
Click New > Basic Diagram > Circular Diagram to start a circular process chart.
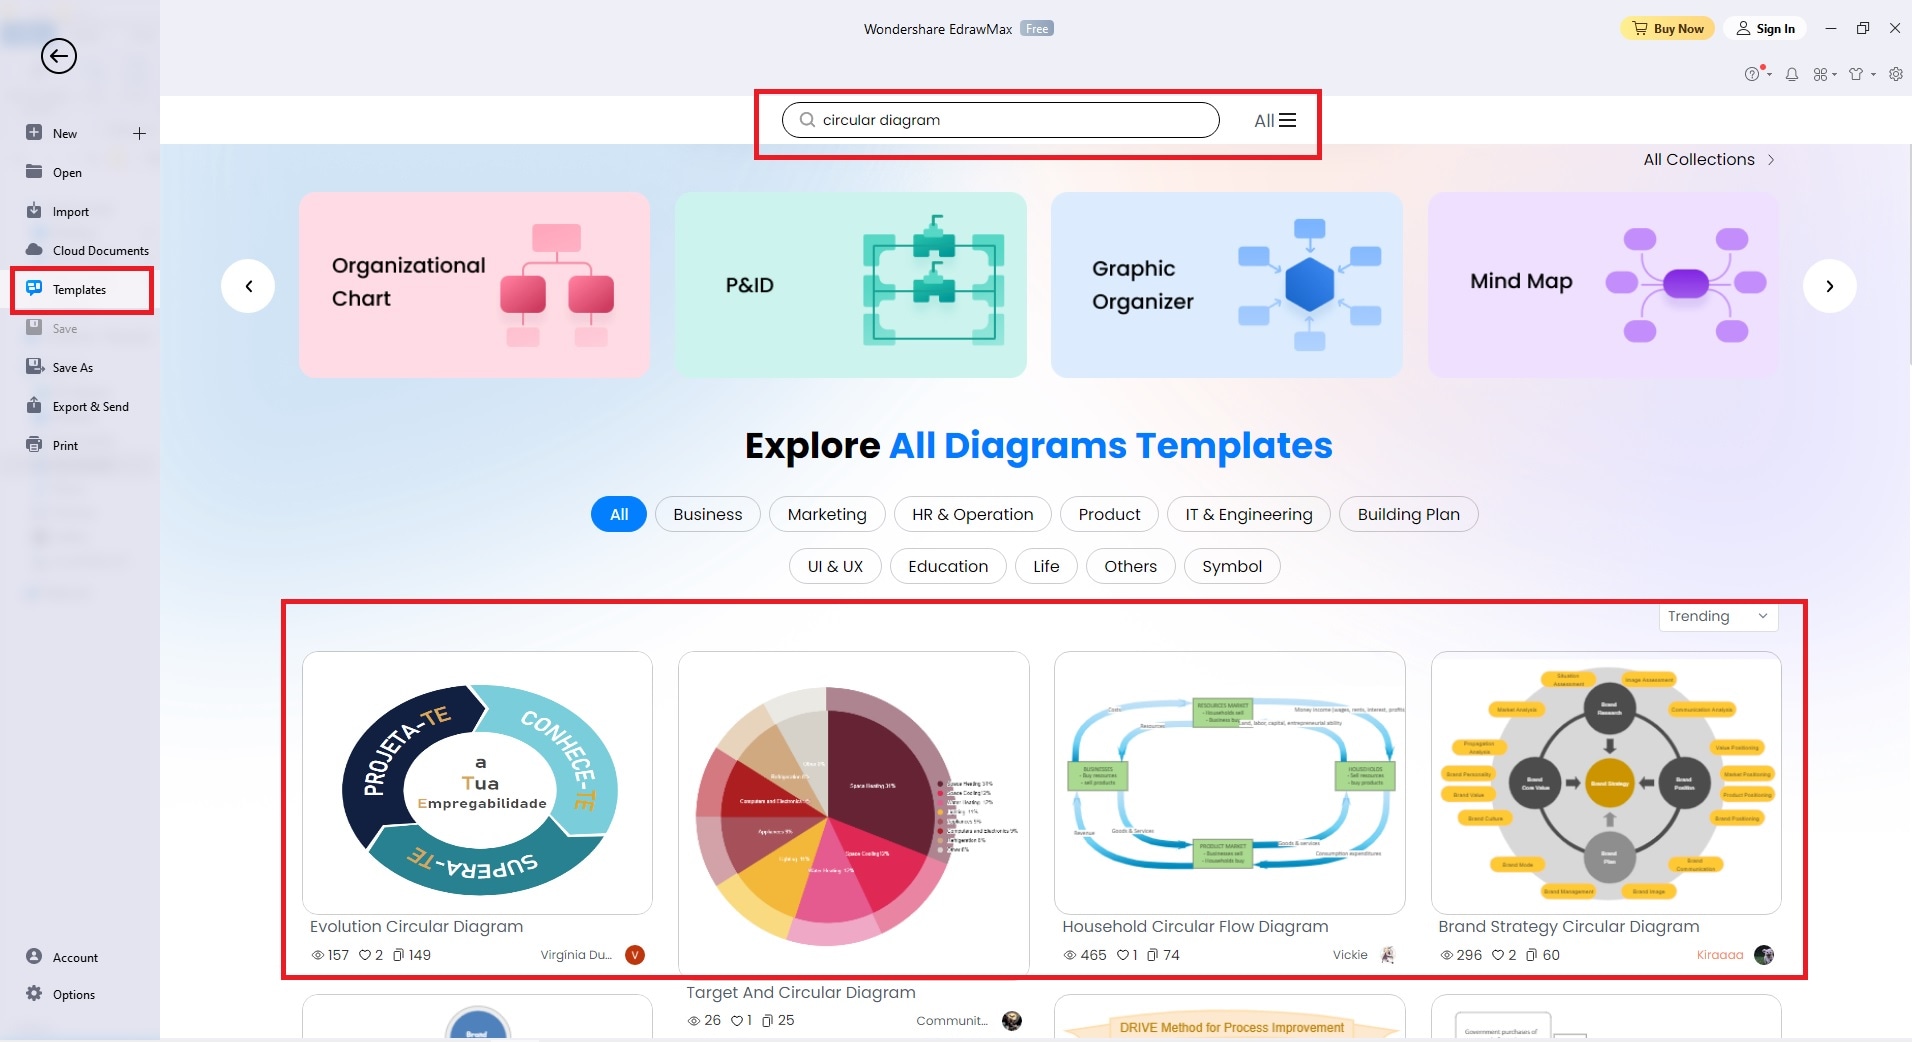
Alternatively, you can click Templates and use the Search Bar. Search and generate a ready-made process circle diagram in one click.
Step3
Edit your circular diagram according to your needs. Use the drag-and-drop feature to place symbols, shapes, and text boxes onto the canvas. Use the Design toolbar to change colors, fonts, line styles, and other visual elements. If necessary, add labels for elements. Include explanatory text where needed. Input relevant data to create a thorough circular diagram.
Step4
After finalizing your diagram, save your work by clicking File > Save or Save As. Or, export the diagram in formats that suit your preferences. You can export it to PNG, JPEG, PDF, or even HTML for dynamic sharing.

Using Wondershare EdrawMax as Your Diagramming Tool
Wondershare EdrawMax simplifies the creation of circular process charts in one click. This tool transforms intricate diagrams, charts, and concepts into visual representations. With EdrawMax's powerful features, you can enhance your diagramming pursuits to a higher level.
Key Features
Below is what makes Wondershare EdrawMax the perfect tool for diagramming.
- Edraw AI Enhancement. With a few simple clicks, Edraw AI can organize information. It can establish connections and provide design suggestions. Edraw AI ensures that your diagrams are adept at conveying your concepts.
- Intelligent Symbol Repository: Use the comprehensive pre-existing symbol library to craft diverse diagrams. Further, personalize them by importing your symbols.
- Seamless Iconfont and Pixabay Integration. Access a vast array of icons through IconFont integration. You'll also gain access to a wide range of image resources. This includes photos, vector graphics, and illustrations with Pixabay.
- Pre-designed Templates. You can take advantage of the vast amount of pre-designed templates. These templates allow you to generate captivating diagrams and infographics in one click.
Wondershare EdrawMax User Reviews
This section highlights the advantages of using EdrawMax. The reviews are straight from user reviews on g2.com
Your Go-To App for all your Diagram needs – Abdul W.
Abdul W. appreciates Wondershare EdrawMax's user-friendly nature and simple interface. The software offers an extensive variety of templates, icons, charts, and pictures through plugins. Abdul also cited the integration of QR codes into diagrams as a noteworthy feature.
Waleed K. highlights Wondershare EdrawMax's minimal and intuitive interface. He praises its compatibility for importing and exporting from various source software. The ability to customize workspace categories and access various templates is also mentioned as a positive aspect.
Part IV. Tips for Creating Clear and Impactful Circular Process Charts
Crafting effective circular process charts involves key principles that ensure clarity and impact. Below are some tips for conveying complex diagrams with precision.
Clarity
Simplicity is important. Design your circular chart with clean lines, minimalistic shapes, and straightforward labels. Avoid clutter that could confuse viewers. Focus on clearly conveying each step. Use concise text that captures the essence of the process, enhancing comprehension.
Consistency
Maintain uniformity in colors, shapes, and styles throughout the chart. This consistency provides visual harmony and aids in easy navigation. A coherent color palette, shapes, and icons help viewers understand the process flow.
Coherence
Arrange the steps logically. Follow a clockwise or counterclockwise sequence. This allows you to align the circular nature of the chart. Ensure that the flow of the process follows a natural progression. This coherence enhances the chart's storytelling ability. It allows viewers to follow the process with ease.
Conclusion
This article demonstrates the significance of circular process charts within project management. Through clear examples and insights, these diagrams are a great tool for visualizing various use cases.
For creating your circular process diagrams, consider using Wondershare EdrawMax. This intuitive platform offers a diverse array of diagramming solutions. You can also elevate your project management by using EdrawMax's Templates Community. Start crafting dynamic diagrams that transform complexities into clarity.

