EdrawMax User Guide for Desktop
Add Special Objects
EdrawMax's Add Special Objects feature includes functions like inserting:
- containers,
- shapes,
- vector texts,
- formulas,
- font symbols,
- page numbers,
- dates,
- QR codes.
To add special objects, follow the steps below:
Step 1: Navigate the Insert tab and search for the Diagram Parts, Text, and Others.

Step 2: Select one from the following operations to customize your diagram or chart:
- Container
- Shape
- Vector Text
- Formula
- Font Symbol
- Page Number
- Date
- QR Code

Insert Container
Inserting Containers can organize and visually represent the hierarchy and structure of the organization. Here are the steps to insert a container in your diagram or chart:
Step 1: Click the Container option and select the best container that suits your preferences.

Insert Shape
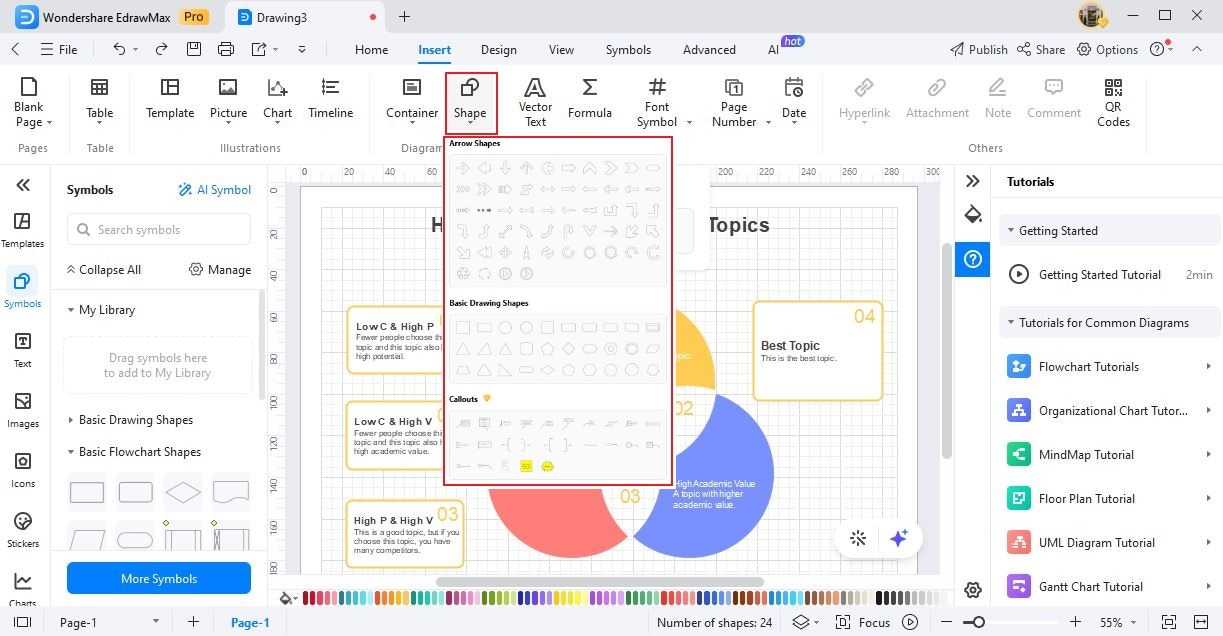
Inserting shapes can visually represent and organize elements within diagrams, charts, or documents. To insert shapes, follow these steps:
Step 1: In the Shape option, select Arrow Shapes, Basic Drawing Shapes, or Callouts. Click your desired shape or drag it into the canvas.
Add Vector Text
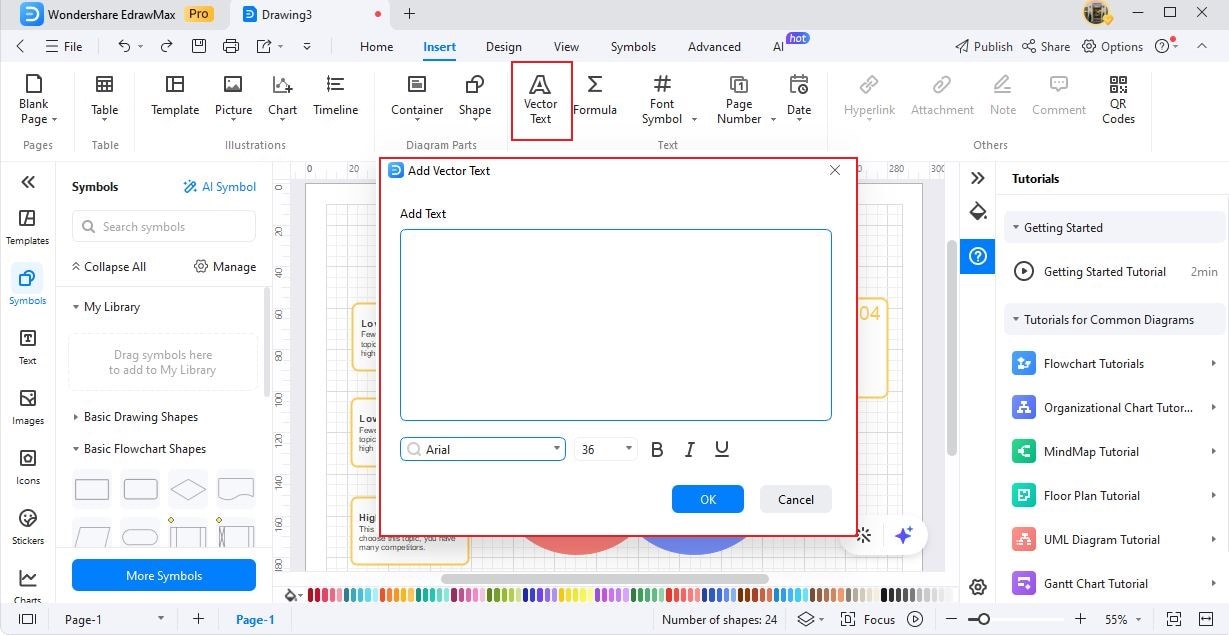
Adding vector text can create high-quality, scalable text elements that can be customized, resized, and manipulated within diagrams, charts, or documents. To add a vector text, follow these basic steps:
Step 1: Click Vector text on the Insert tab or press Ctrl + Shift + V. Input the words on the pop-up Add Vector Text window.
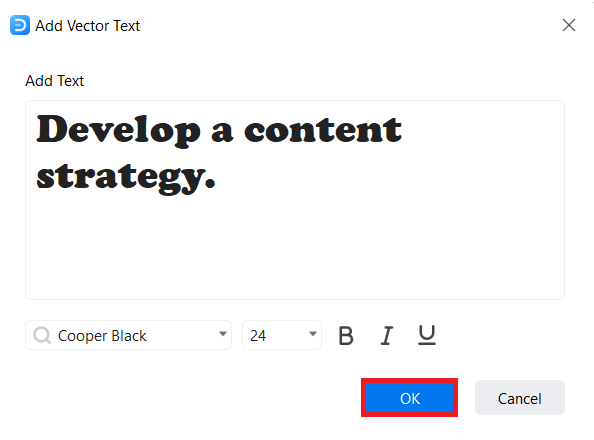
Step 2: Modify the font style and font size and click OK.
Insert Formula
Inserting a formula in a diagram or chart enables real-time calculations and enhances functionality by displaying mathematical or logical relationships within the visual representation. Here are the steps to insert the formula:
Step 1: Click Formula on the Insert tab or press Ctrl + Alt + E.
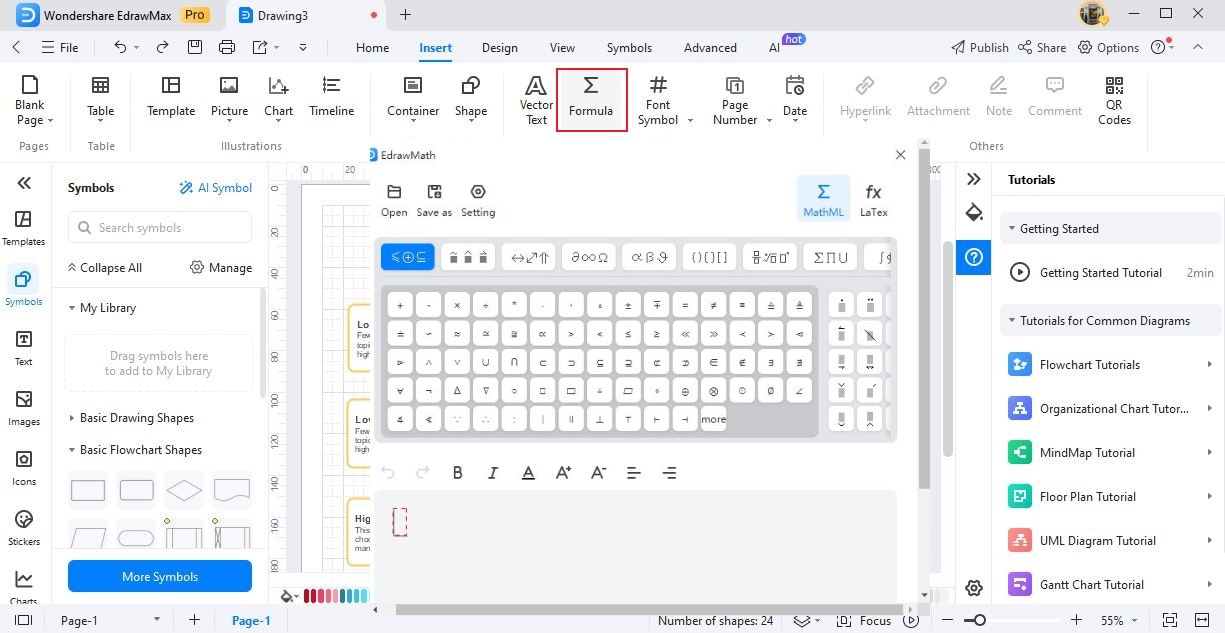
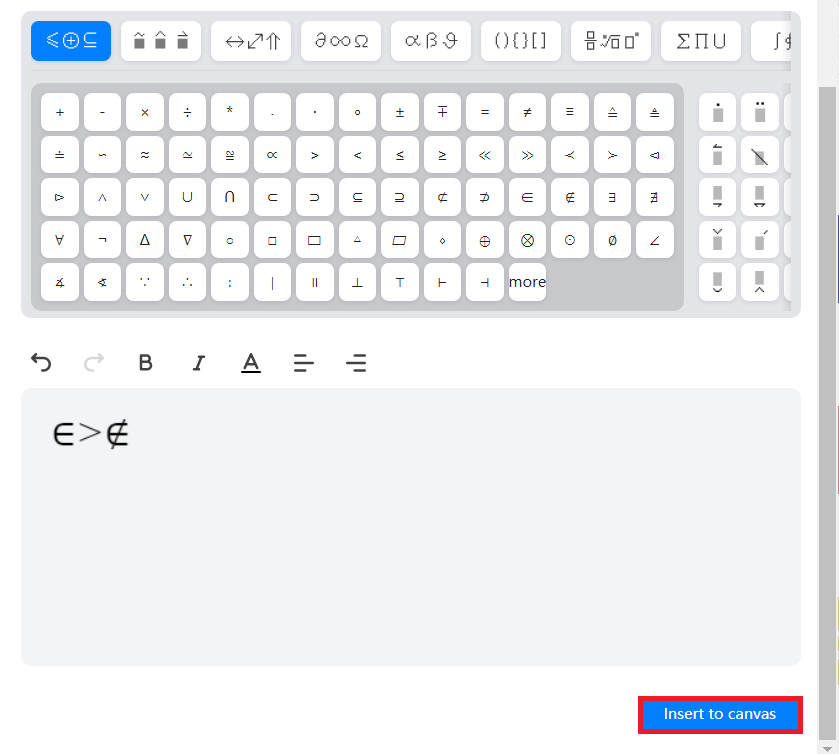
Step 2: In the EdrawMath pop-up window, use the integrated text tools and mathematical symbols to edit the math equations of your choice. Click Insert to Canvas once finished.
Insert Font Symbol
Inserting font symbols in charts or diagrams can add visual elements that convey specific meanings, concepts, or information. It enhances the chart or diagram's clarity and communicative power. Here are the steps to insert font symbols:
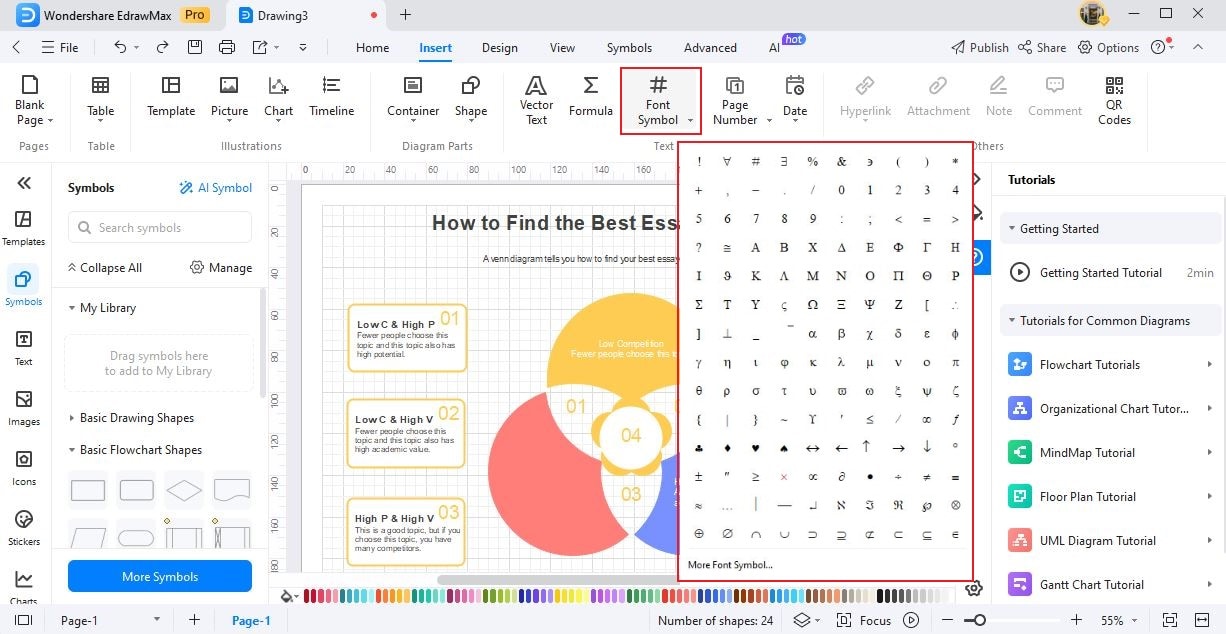
Step 1: To add standard symbols, go to the Insert tab. Click Font Symbol and hover your cursor over the menu to select the symbol that you want.
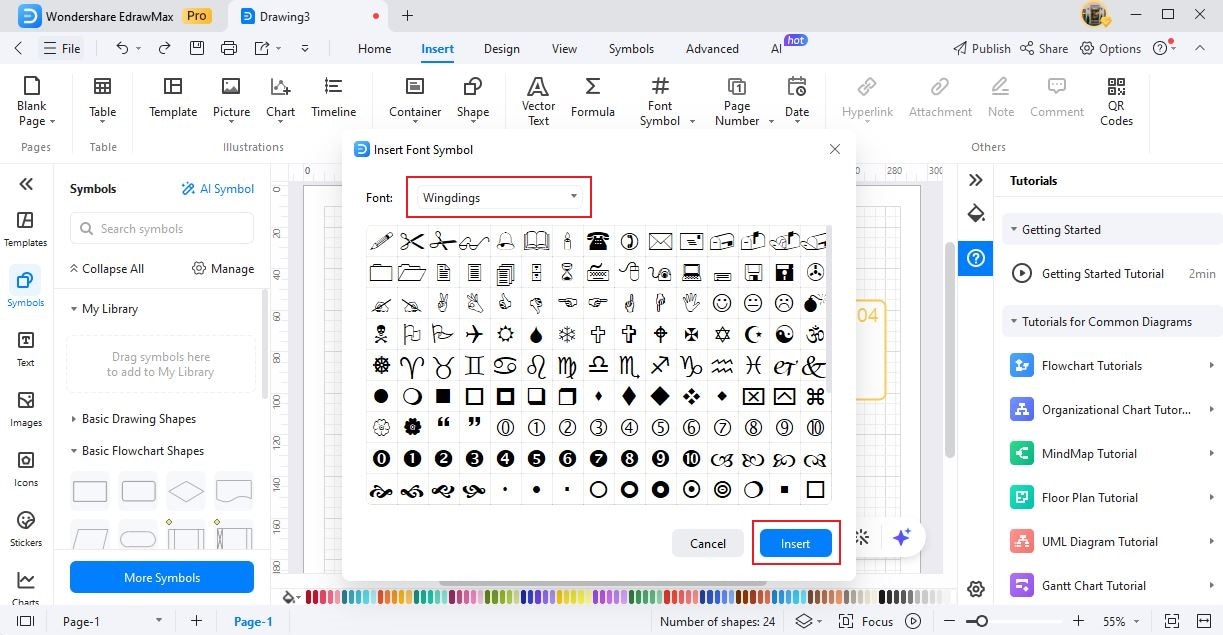
Step 2: For more symbols, click More Font Symbol to open the Insert Font Symbol window. Switch symbol categories by clicking Font. After selecting your desired symbols, click Insert.
Insert Page Number
Inserting Page Numbers provides a systematic way for readers or viewers to navigate the content. It enables them to locate specific sections or pages and enhance the overall organization and accessibility of the material. To insert a page number, follow these steps:
Step 1: Go to the Page Number section. You can select Page Number Style or Page Number Position based on your needs.
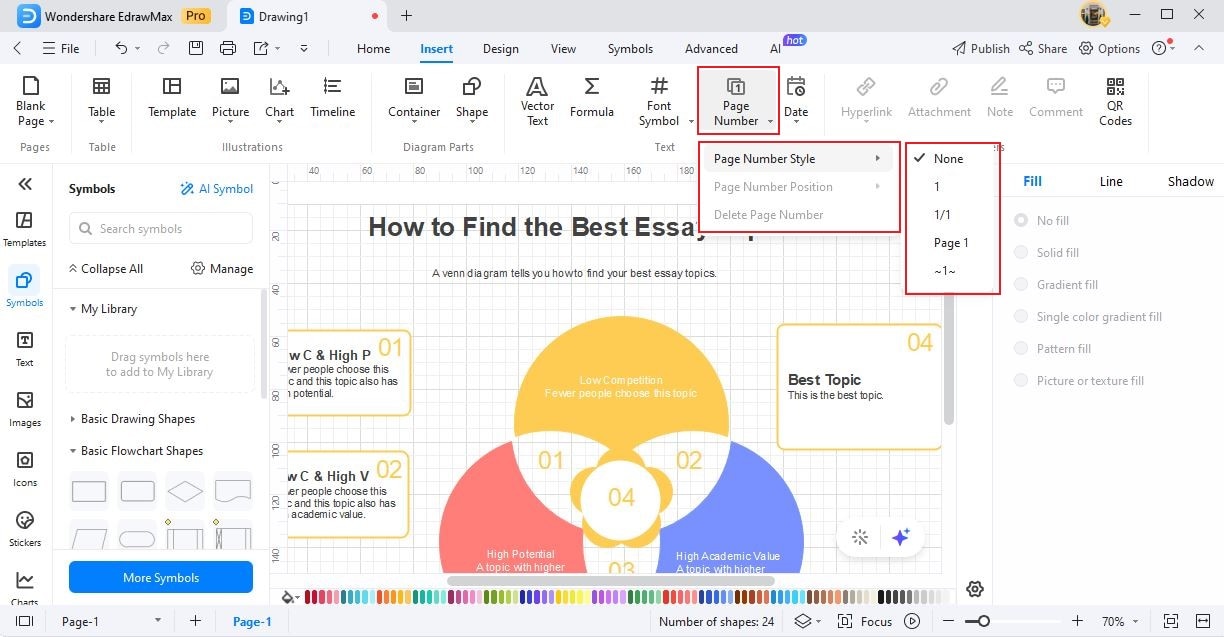
Note: If you want to remove page number, click Delete Page Number from the options.
Insert Date
Inserting Date can visually represent and communicate complex information, making it easier to understand, analyze, and draw insights from the data. Here are the steps for inserting a date:
Step 1: Click the Date button to represent a specific point in time associated with a person or position. Choose among different Types, Styles, and Positions for displaying dates in your diagram or chart.
Note: To remove the date, click Delete Date from the options.

Insert QR Code
Inserting a QR code can provide quick and easy access to additional information, resources, or interactive content related to the chart or diagram. Here are the steps to insert a QR Code:
Step 1: Select QR Codes from the Insert tab or press Ctrl + Alt + Q. In the pop-up Insert QR Code window, enter the web URL or text, and EdrawMax will generate the QR code accordingly.
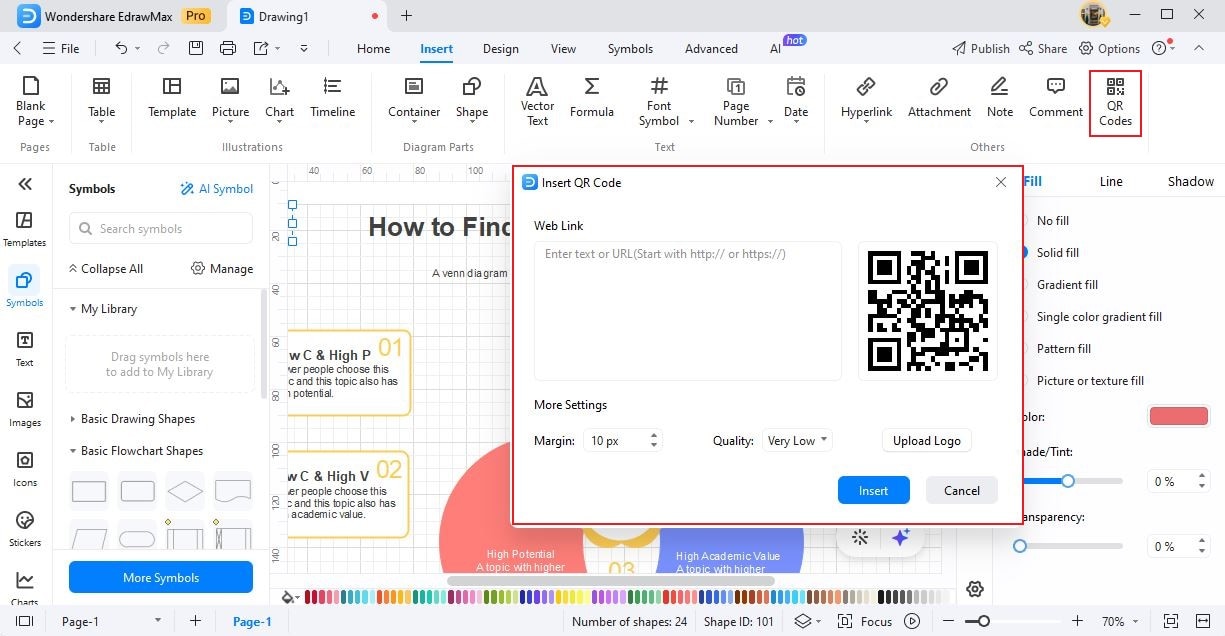
Step 2: Adjust the margin and code quality, then add or remove logos (optional). Click the Insert button once done.
