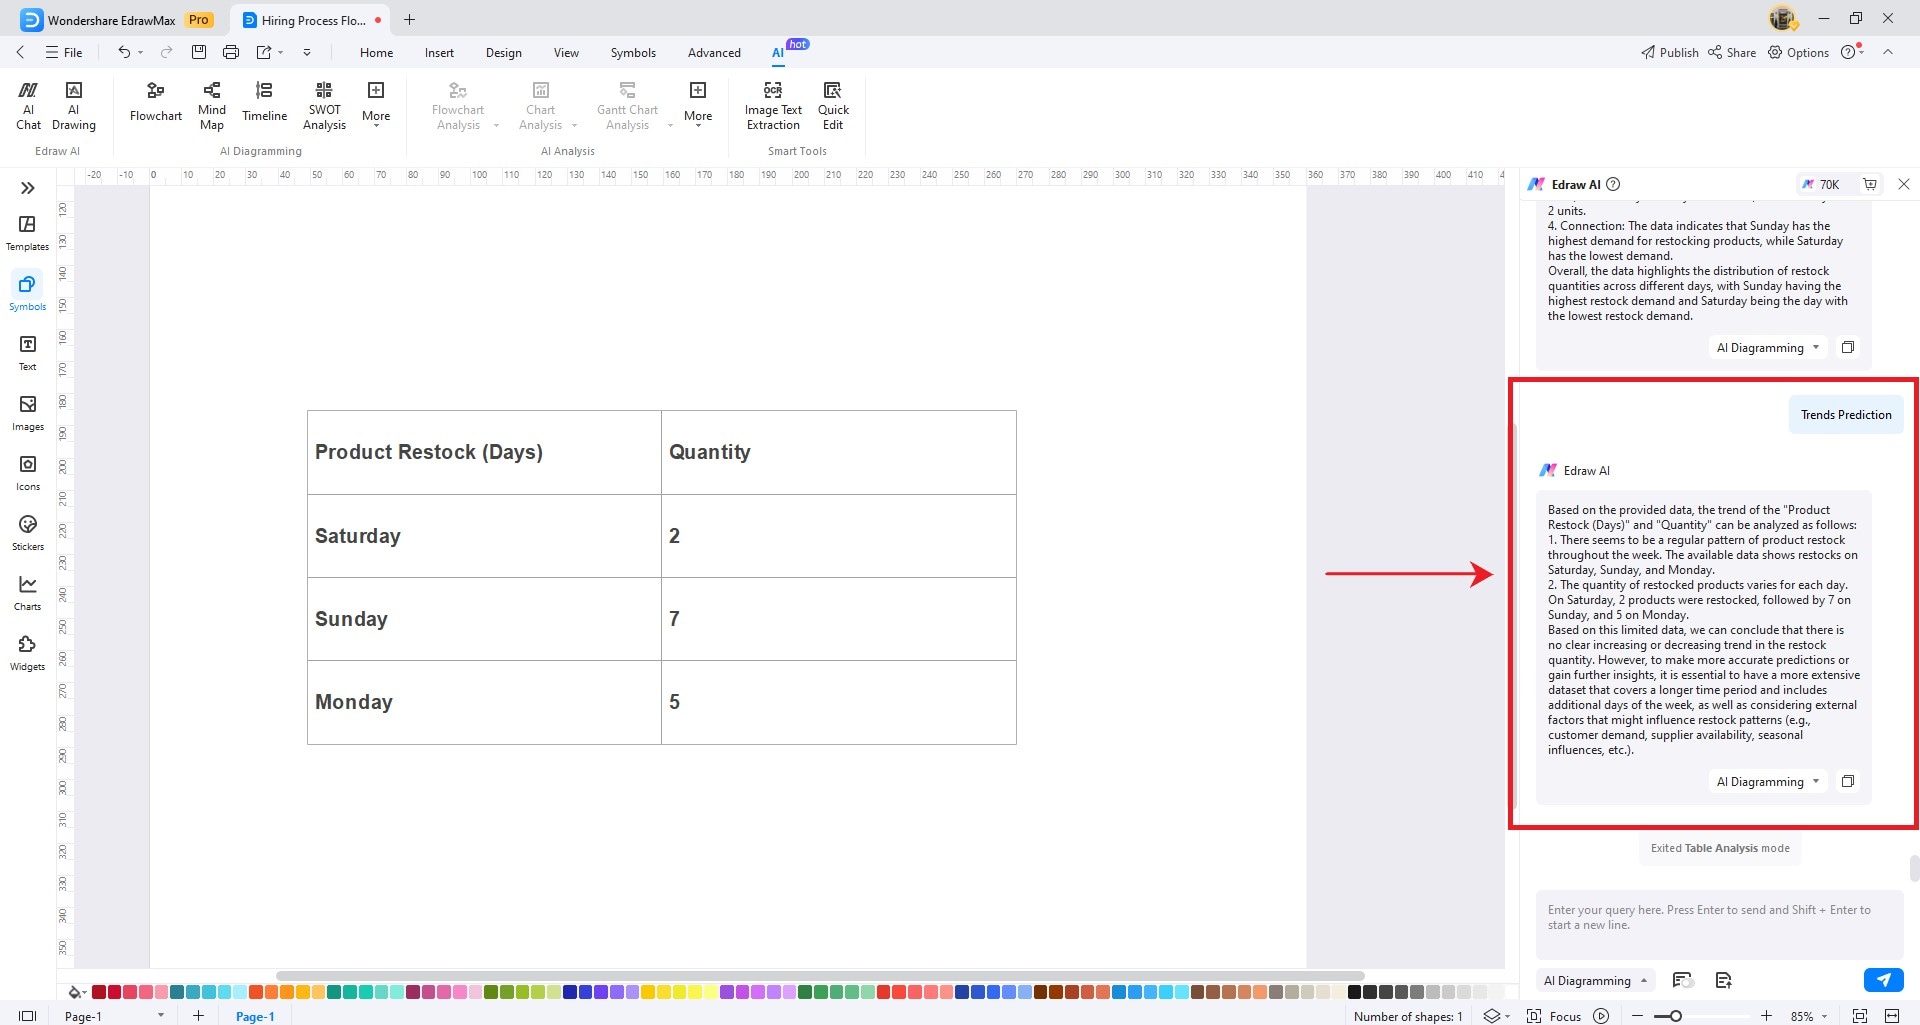
EdrawMax User Guide for Desktop
AI Analysis
AI-powered Organization Chart Analysis
Edrawmax’s Organizational Chart Analysis feature is powered by Edraw AI to help you gain insights into the structure and dynamics of your organization chart. This feature serves two primary purposes: Organizational Analysis and Organizational Diagnosis. Here's how to use the Organization Chart Analysis feature in Edrawmax:
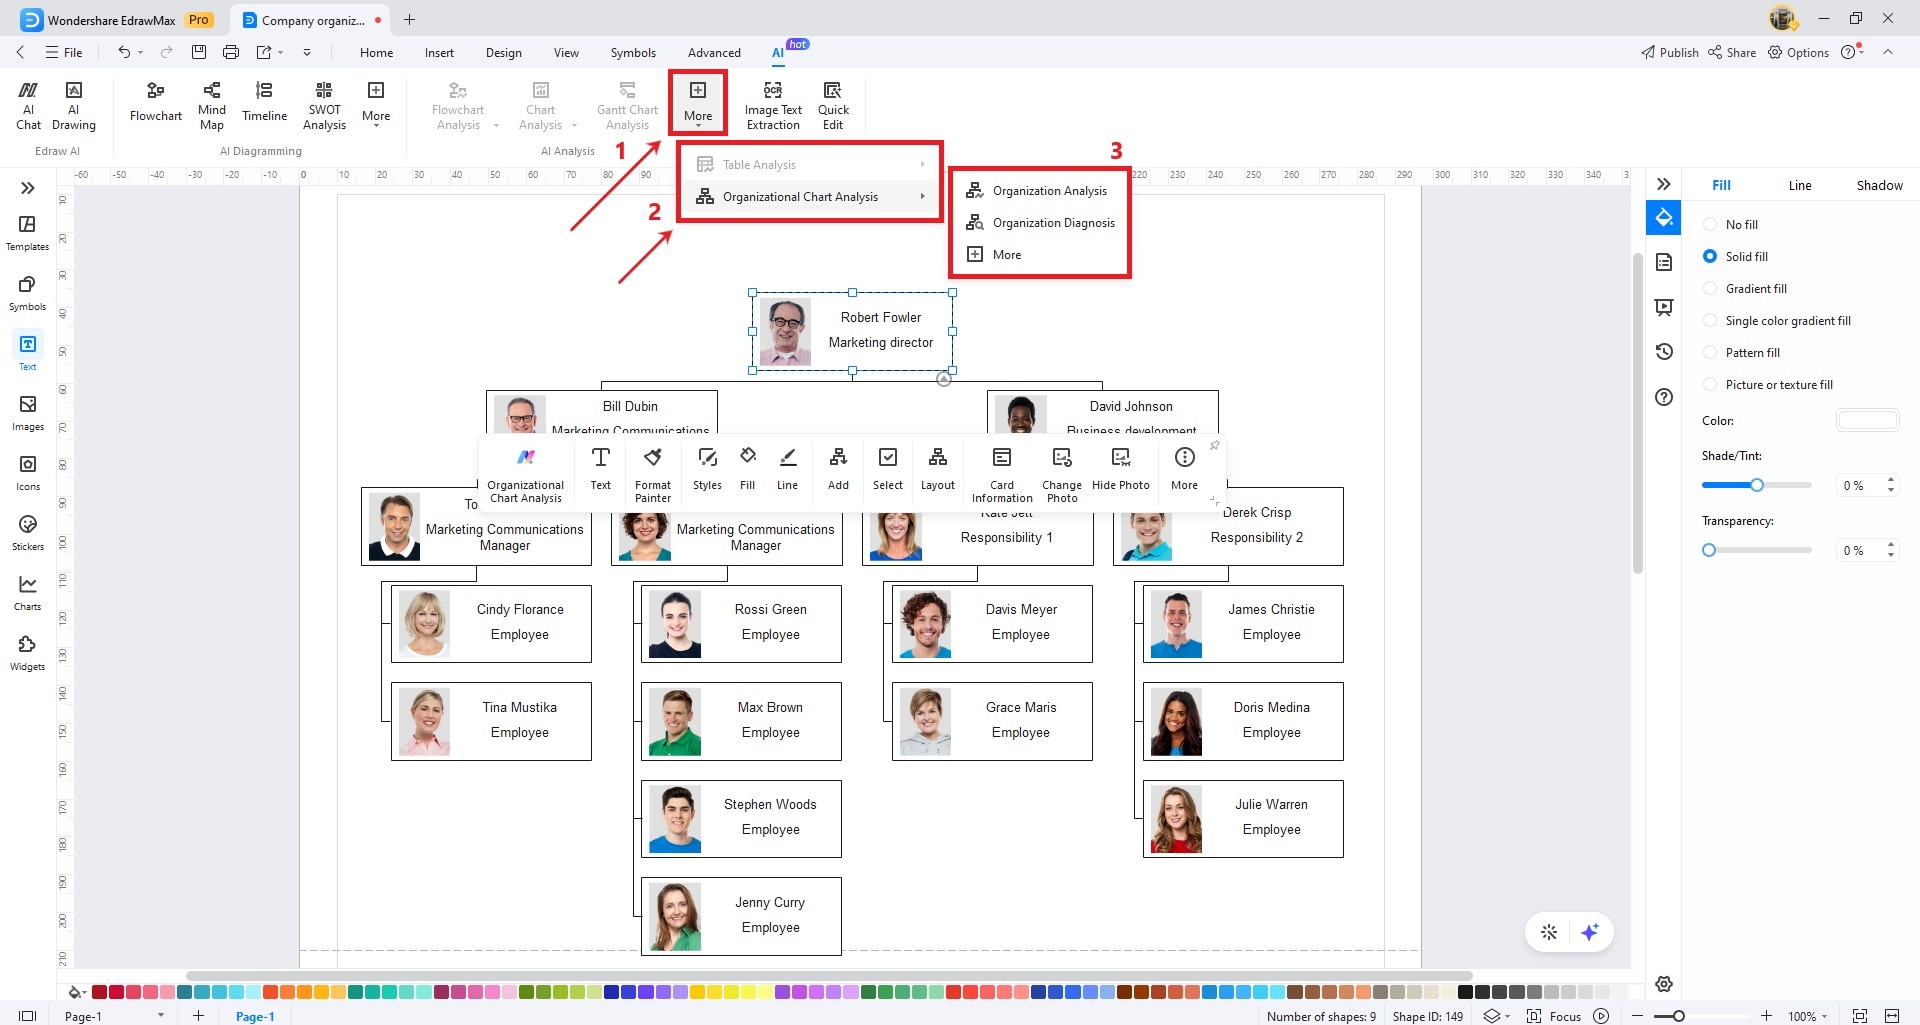
Go to the AI tab on the top toolbar. Click on More and choose Organization Chart Analysis. A menu will appear, and choose the type of analysis you want to perform.
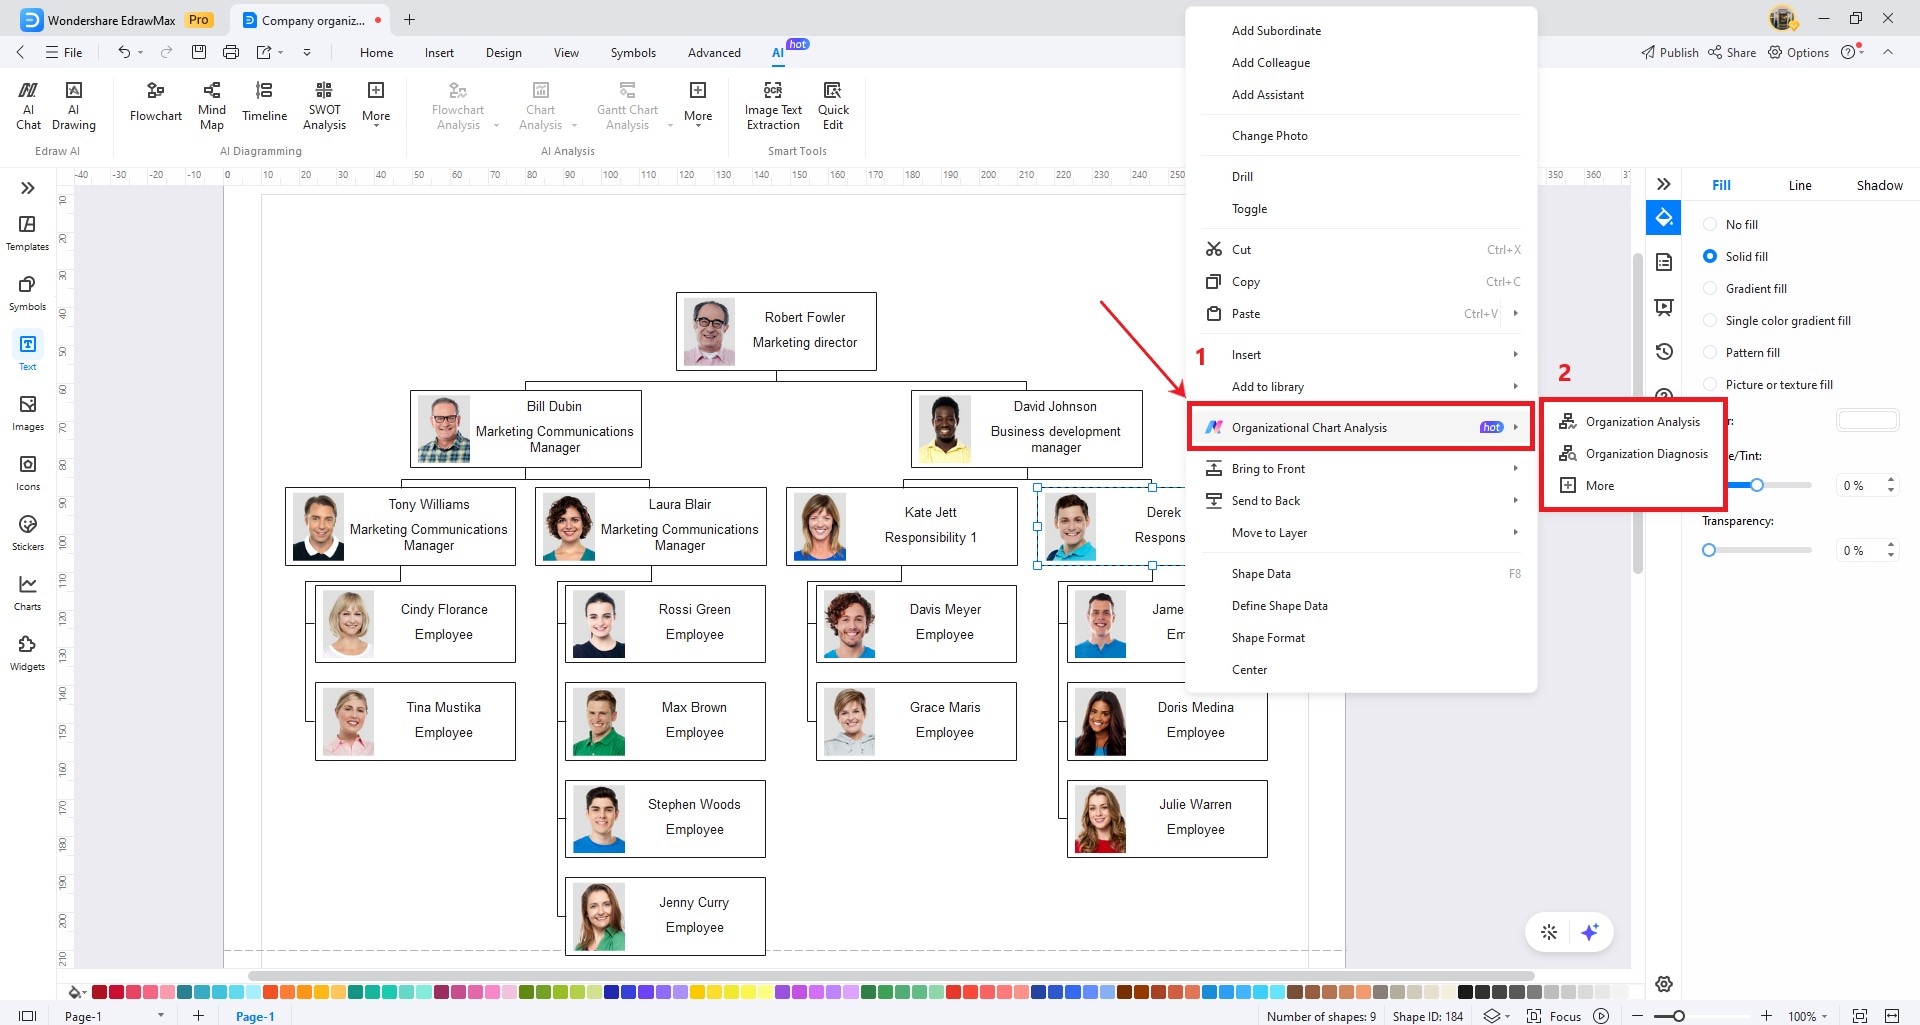
Alternatively, you can right-click on the organization chart you’re working on to access the floating toolbar. Click on Organization Chart Analysis and select the type of analysis you want to perform.
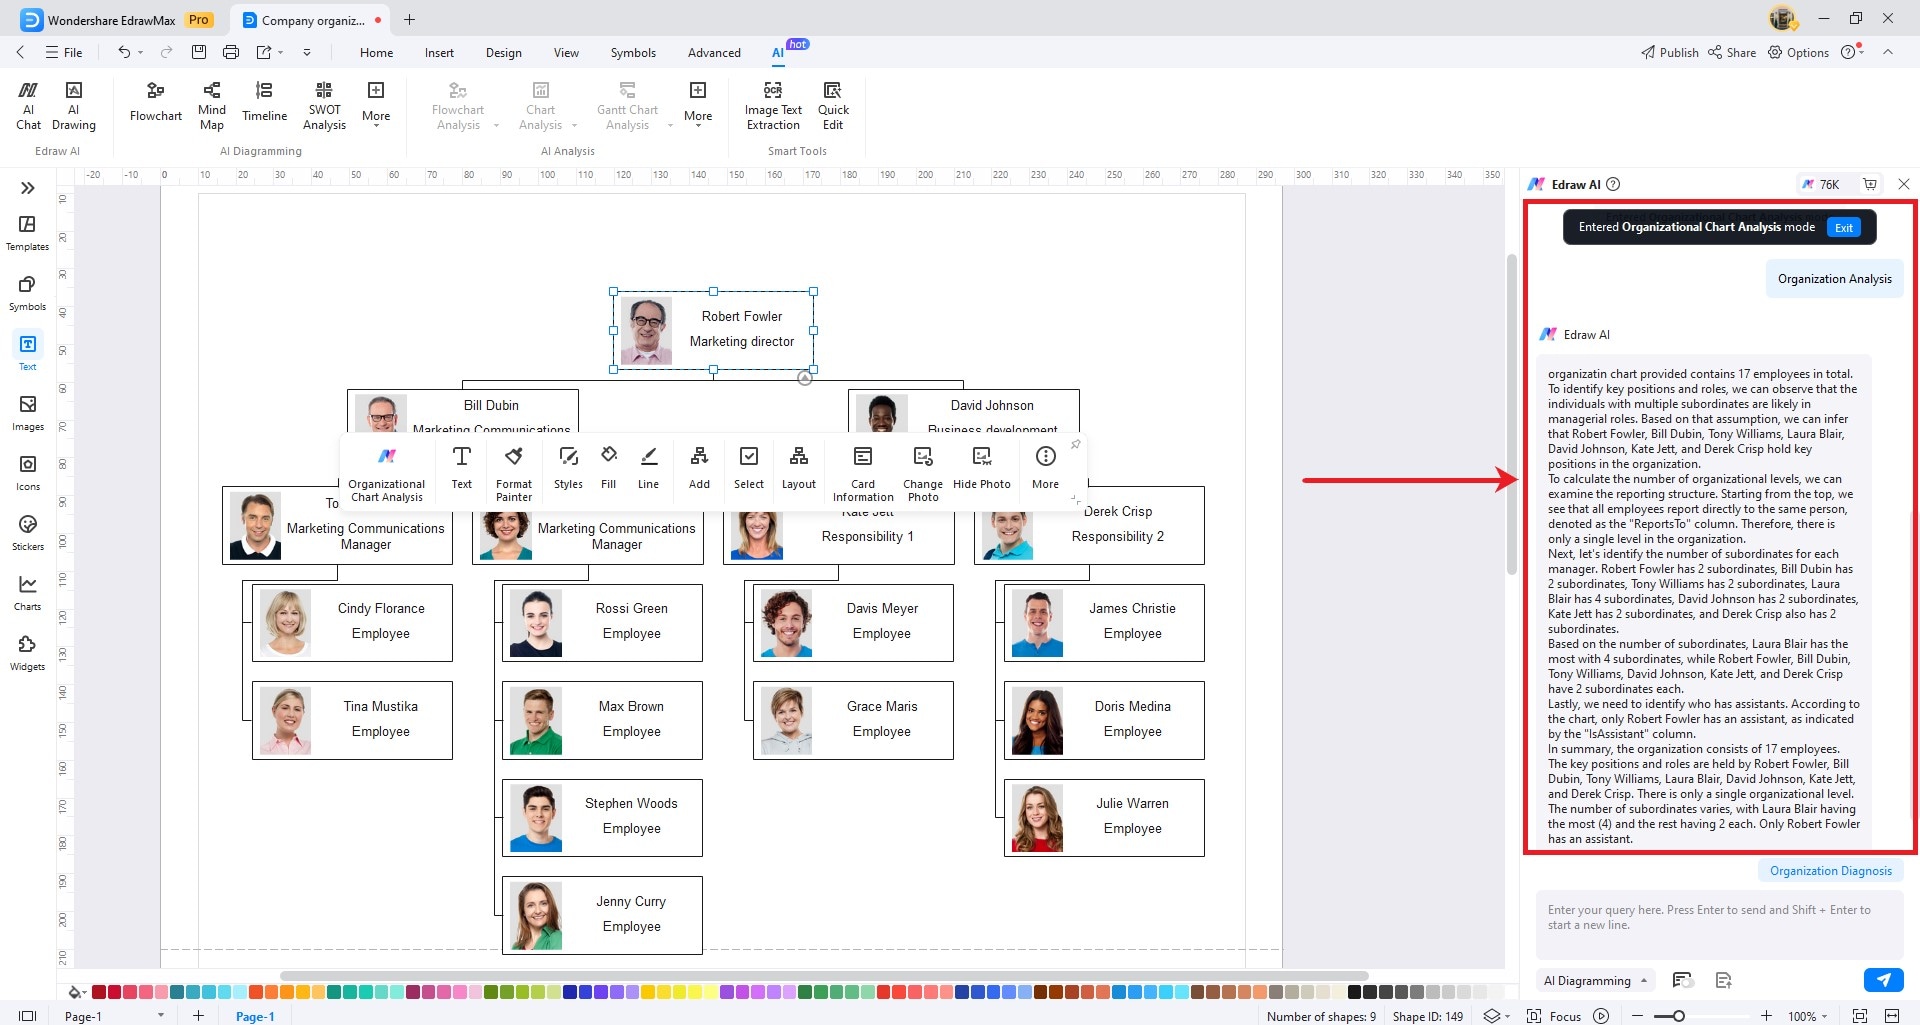
Organizational Analysis
The Edraw AI panel will appear on the right side of the screen. It will now analyze your organizational chart and will sort out information such as the number of people in the organization, key positions and roles, number of organizational levels, number of manager subordinates, most and least subordinates, who has assistants, length of entry, age, maximum age and minimum age, nationality, etc.
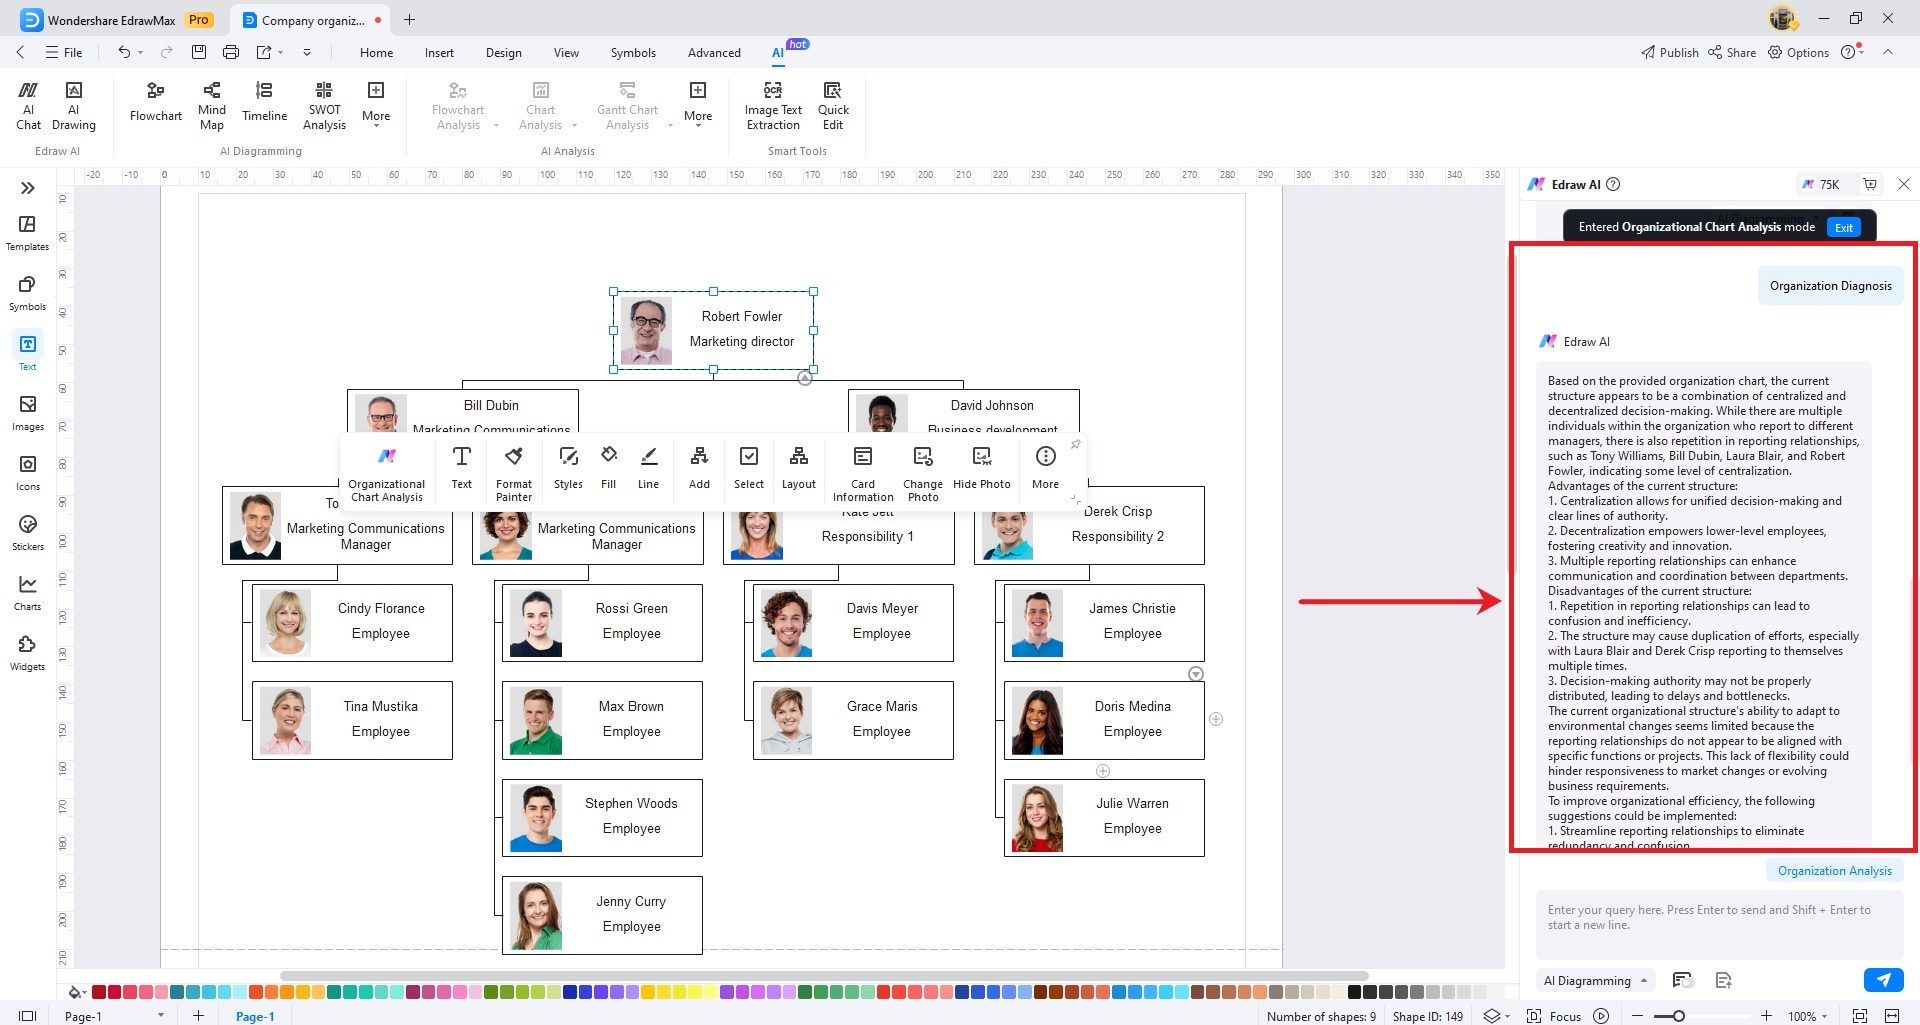
Organizational Diagnosis
The Edraw AI panel will appear on the right side of the screen. It will now analyze your organization's decision-making structure, structure's strengths and weaknesses, environmental adaptability, and recommendations for improvement.
AI Flowchart Analysis
Edrawmax's Chart Analysis feature, powered by Edraw AI, is designed to help you analyze and gain valuable insights from various types of charts. This feature serves multiple purposes, including Data Comparison, Abnormality Identification, Summary Generation, and Trend Prediction. Here's how to use the Chart Analysis feature in Edrawmax:
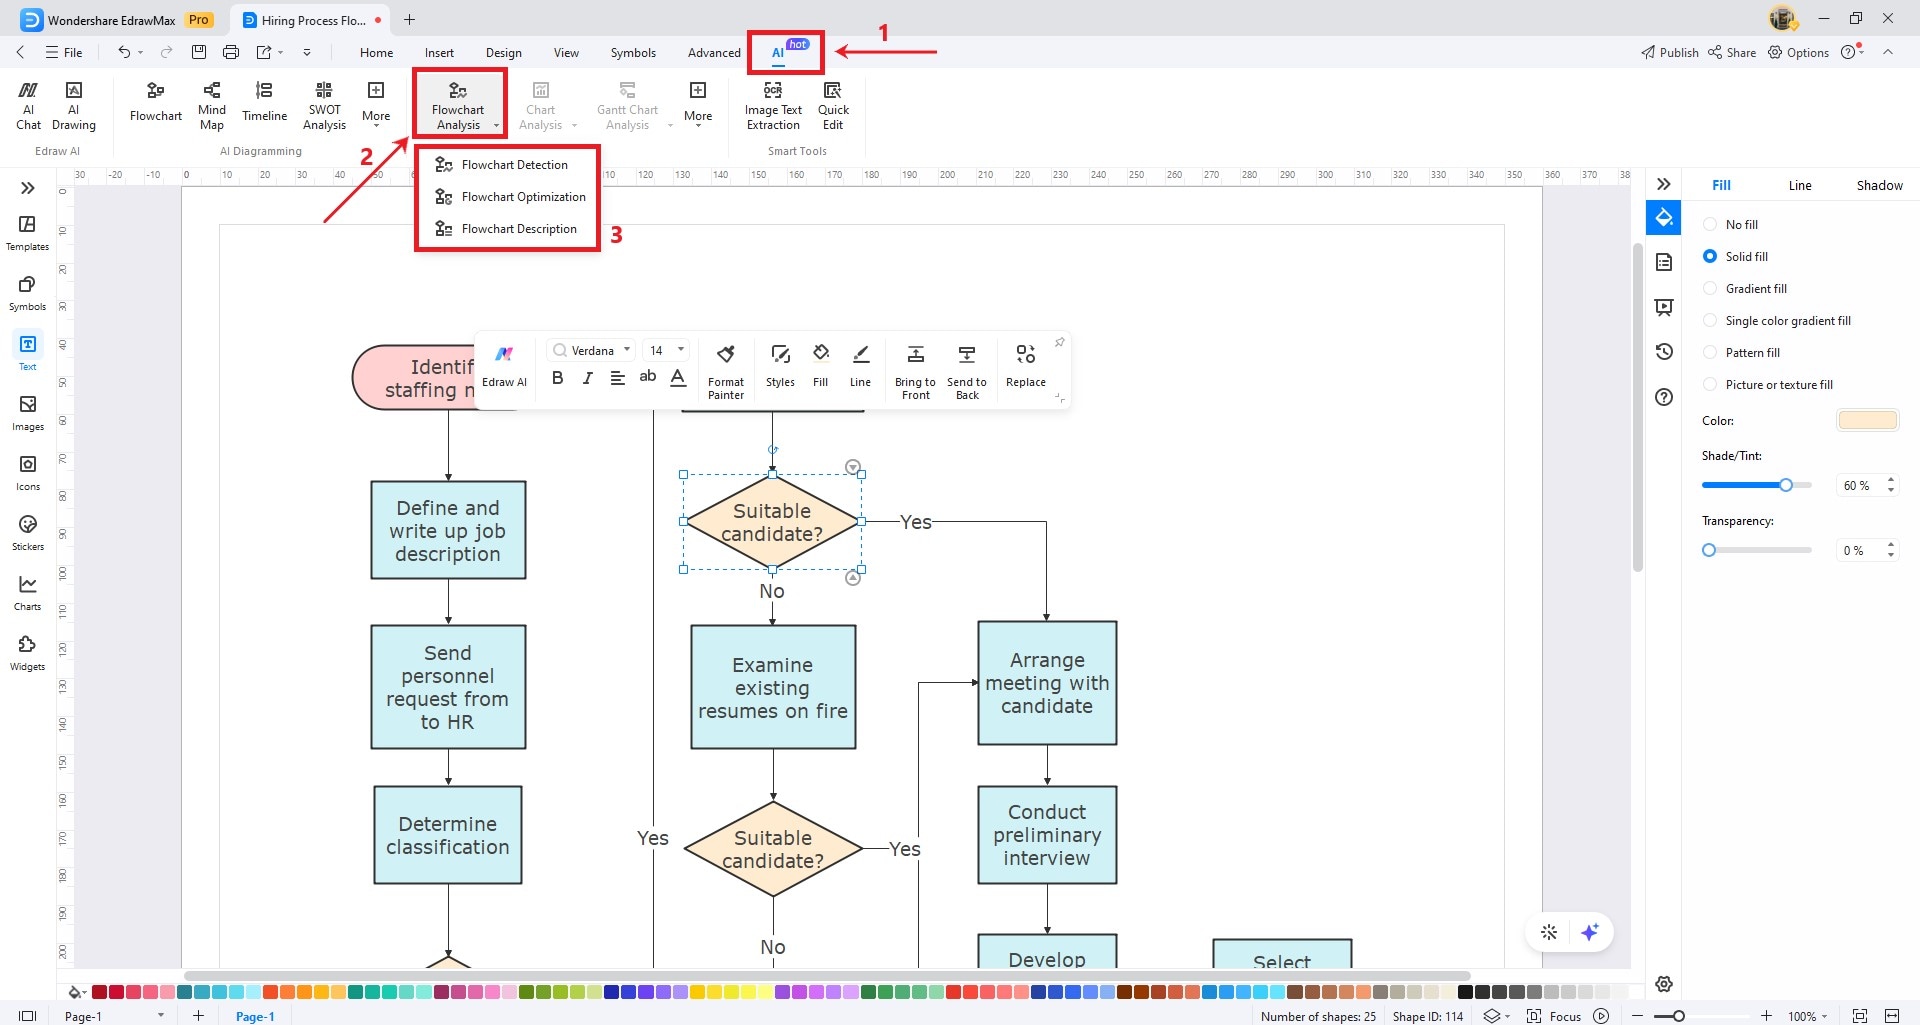
Navigate to the top toolbar. Go to the AI tab and click the Flowchart Analysis button. A menu bar will appear, and choose the type of analysis you want to perform.
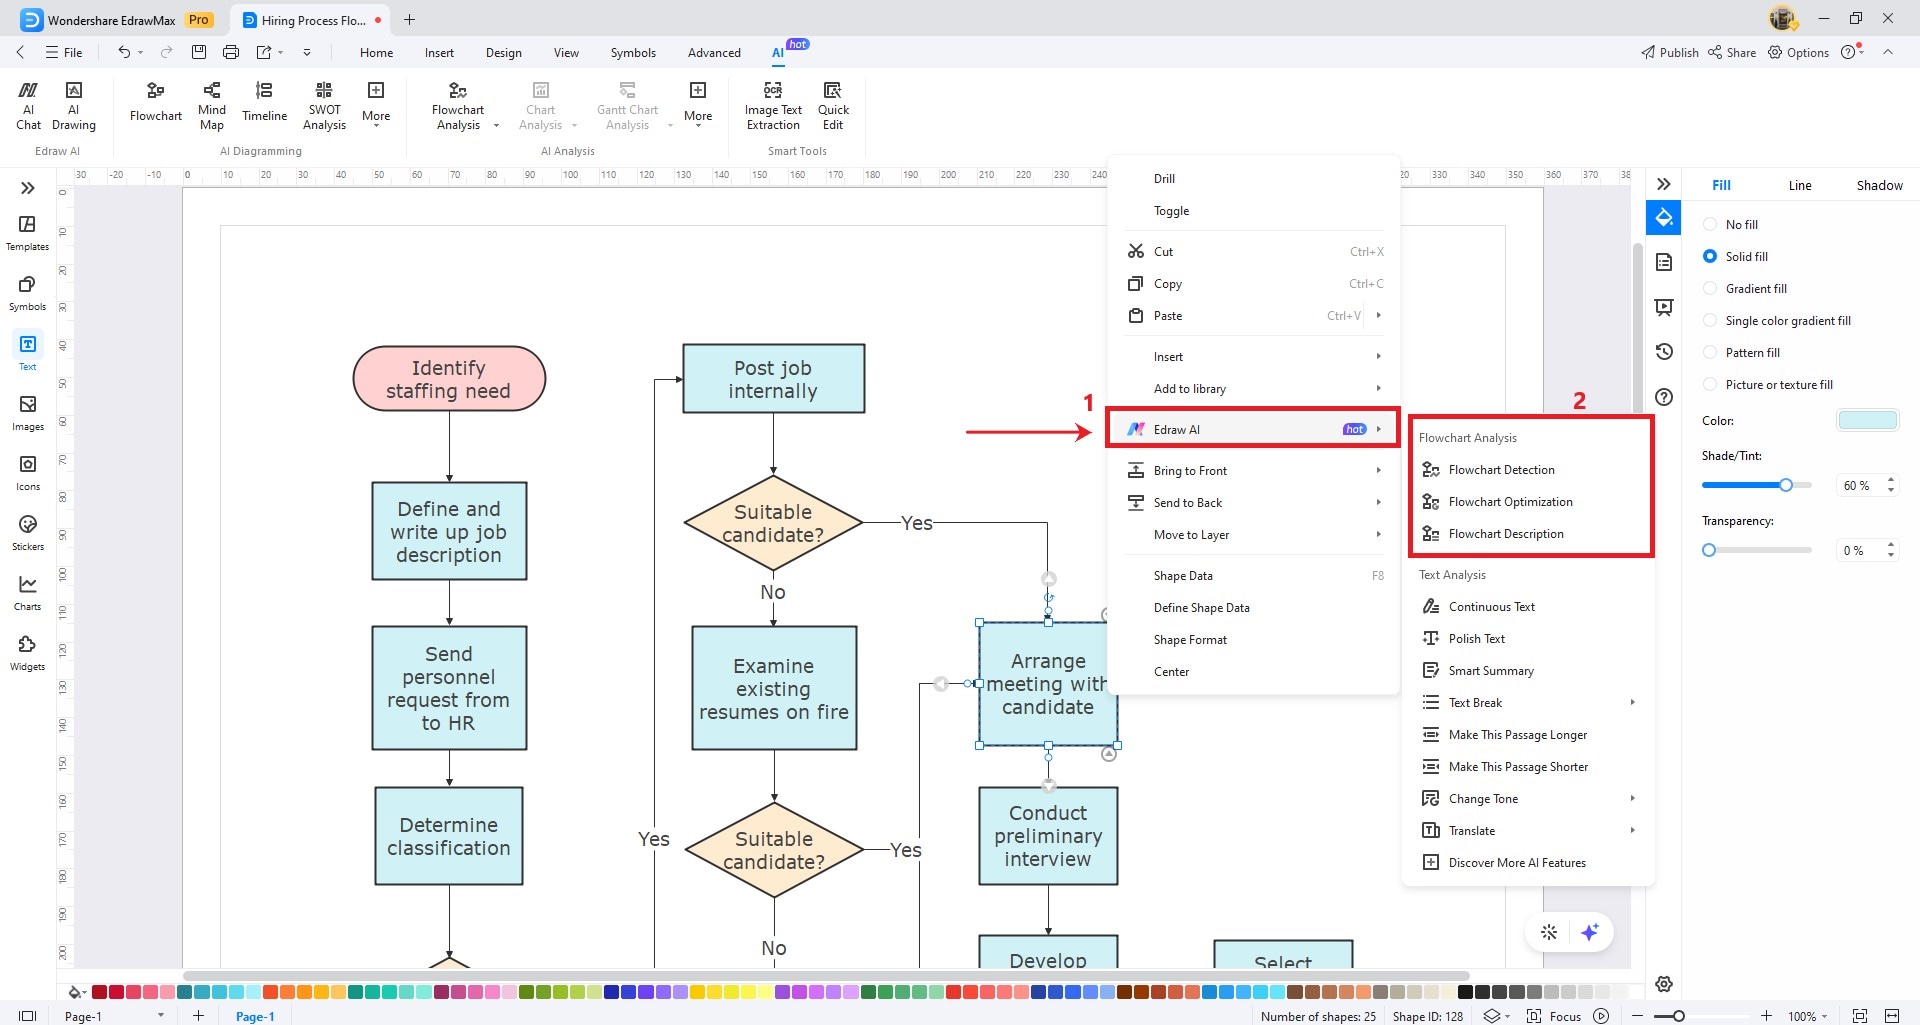
Alternatively, you can right-click on the flowchart you’re working on to access the floating toolbar. Click on Edraw AI and select the type of analysis you want to perform.
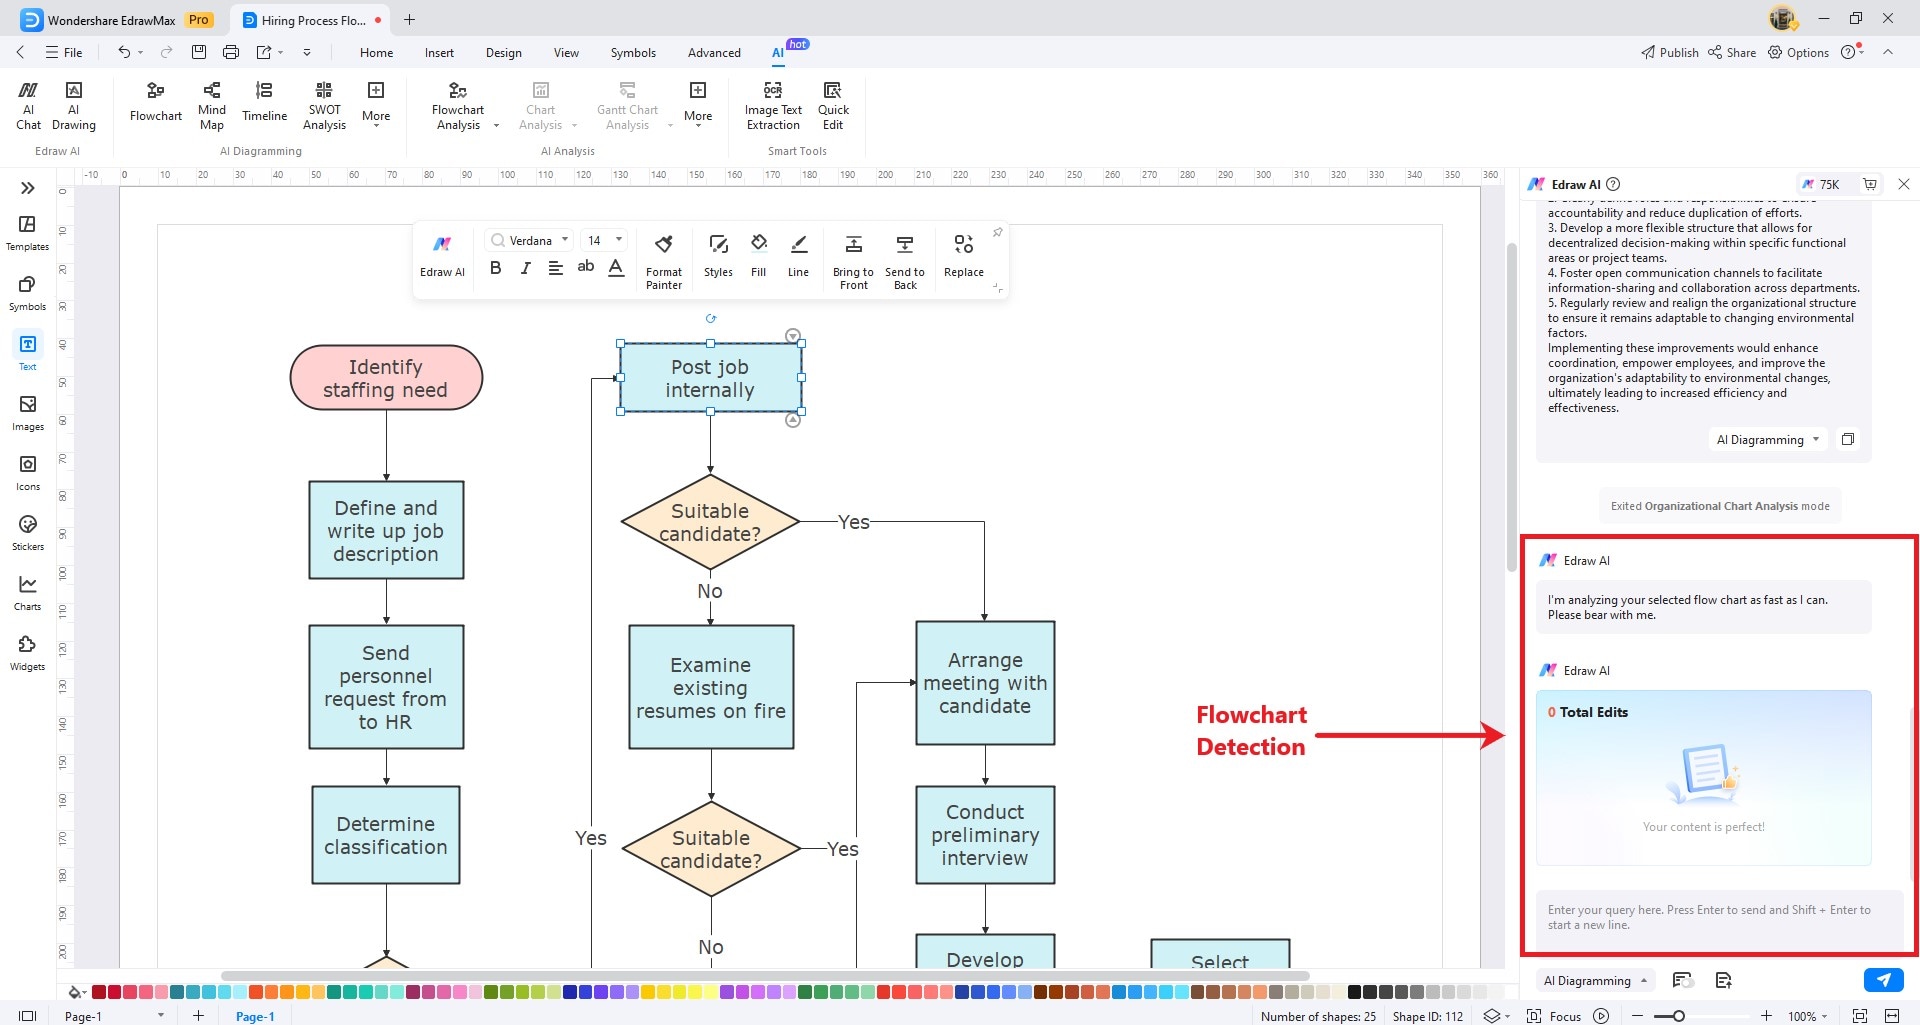
Flowchart Detection
The Edraw AI panel will appear on the right side of the screen and will now analyze your flowchart. It will detect key nodes, processes, and connections within the flowchart. After the analysis, Edrawmax will provide suggestions and insights based on the detected elements.
Flowchart Optimization
The Edraw AI panel will appear on the right side of the screen. It will allow you to choose the type of optimization you want. You can choose to refine process details, supplement logic exceptions, or add new processes.
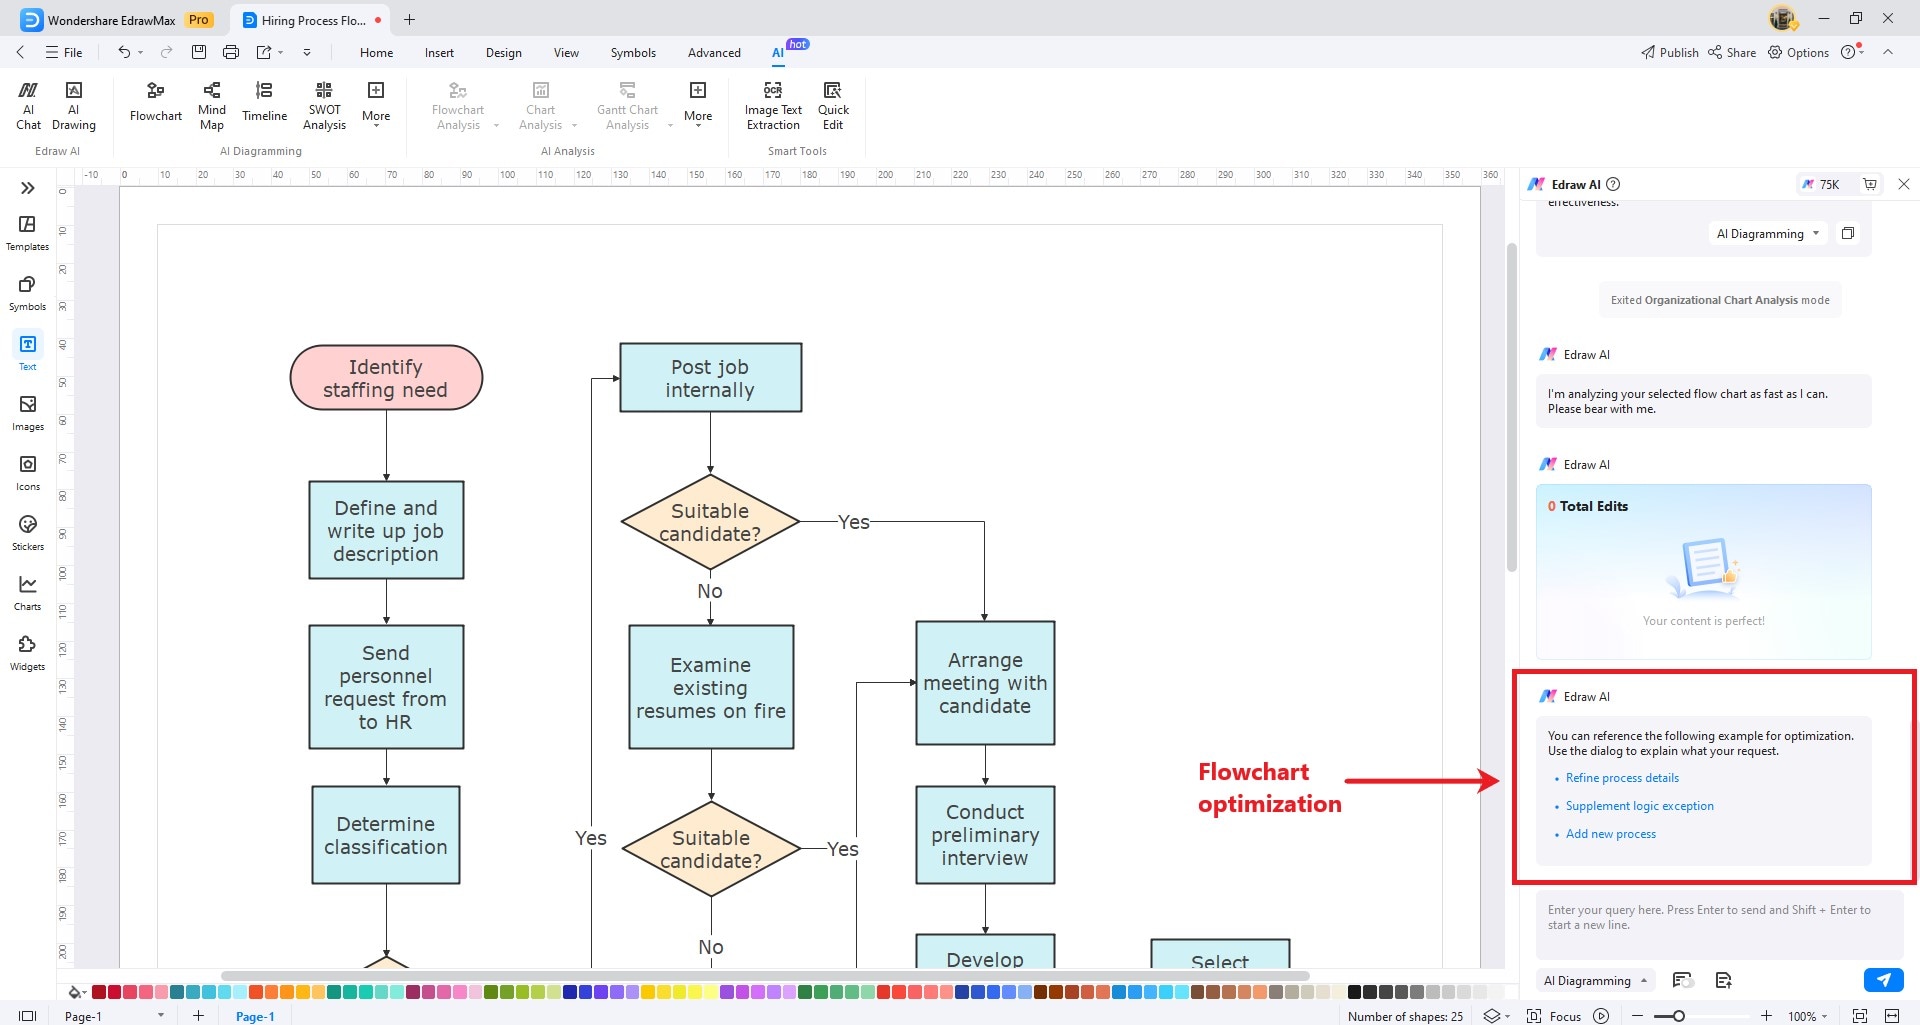
Refine Process Details
Click on the Refine process details option and wait until the optimization is complete.
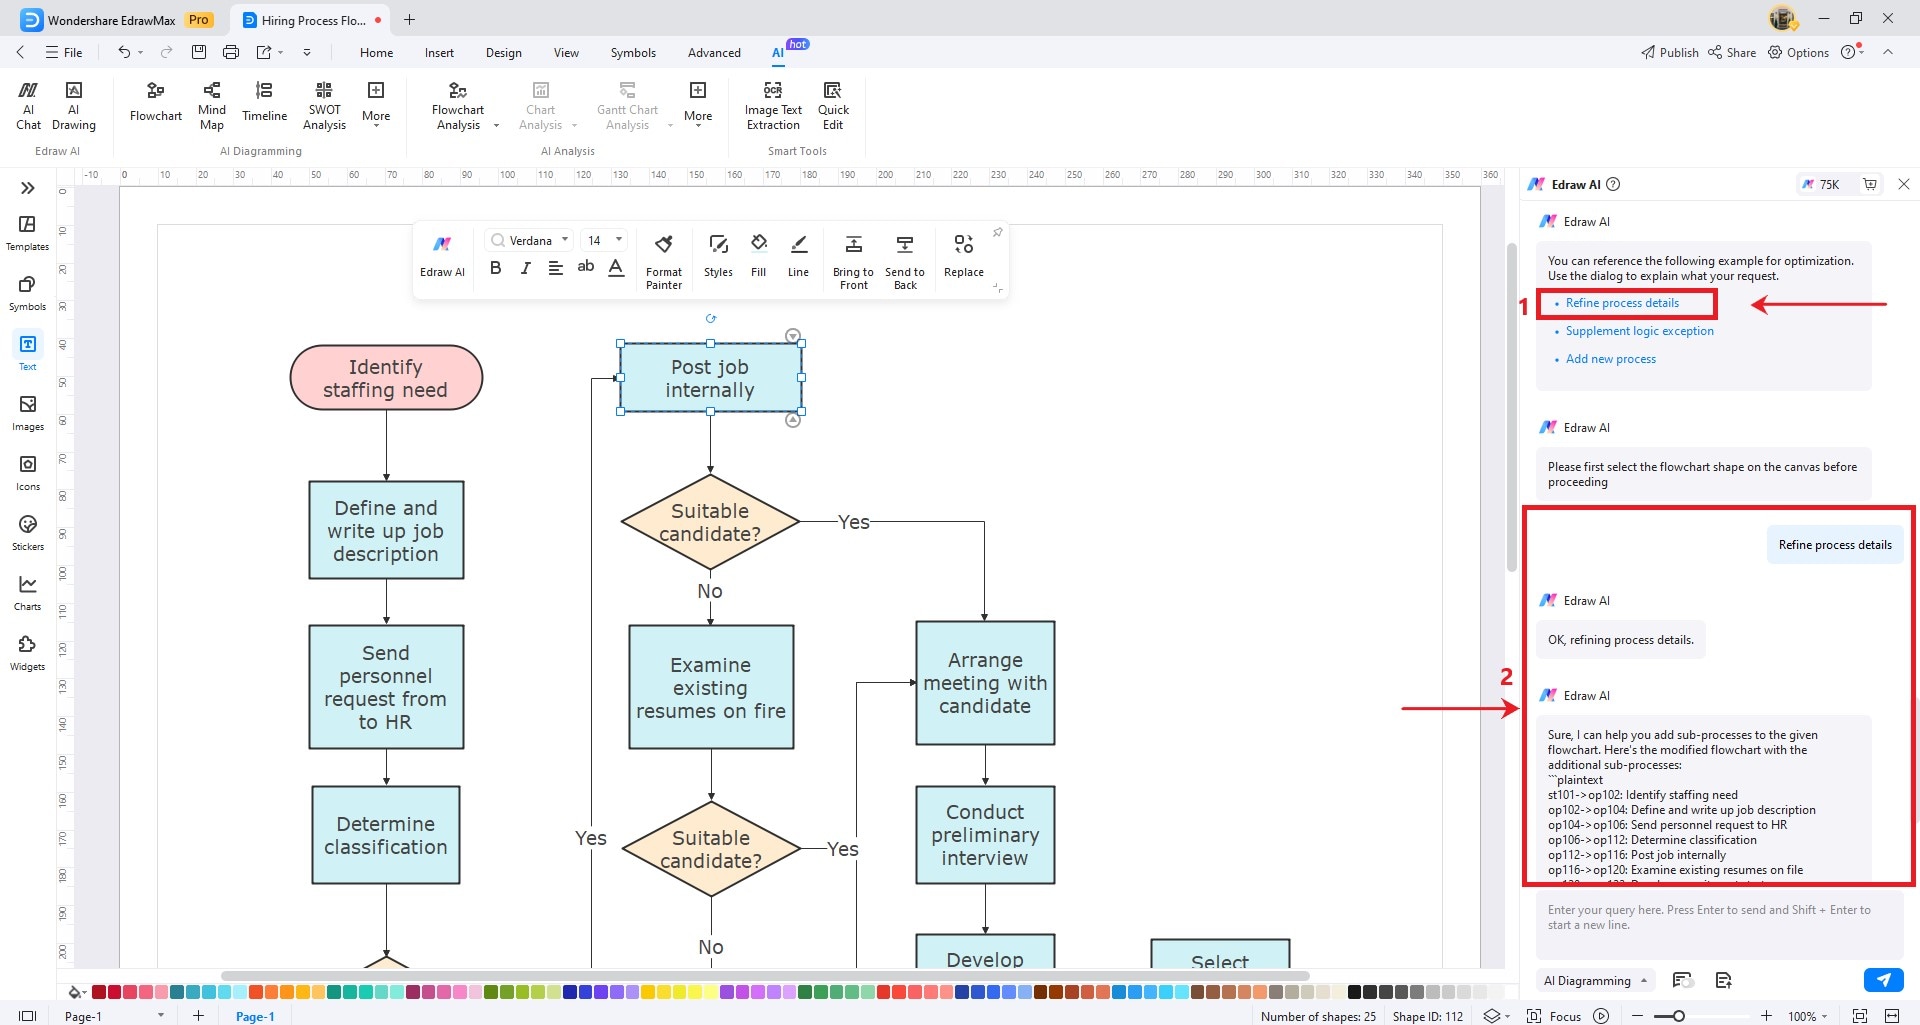
Supplement Logic Exceptions
Click on the Supplement logic exceptions option and wait until the optimization is complete.
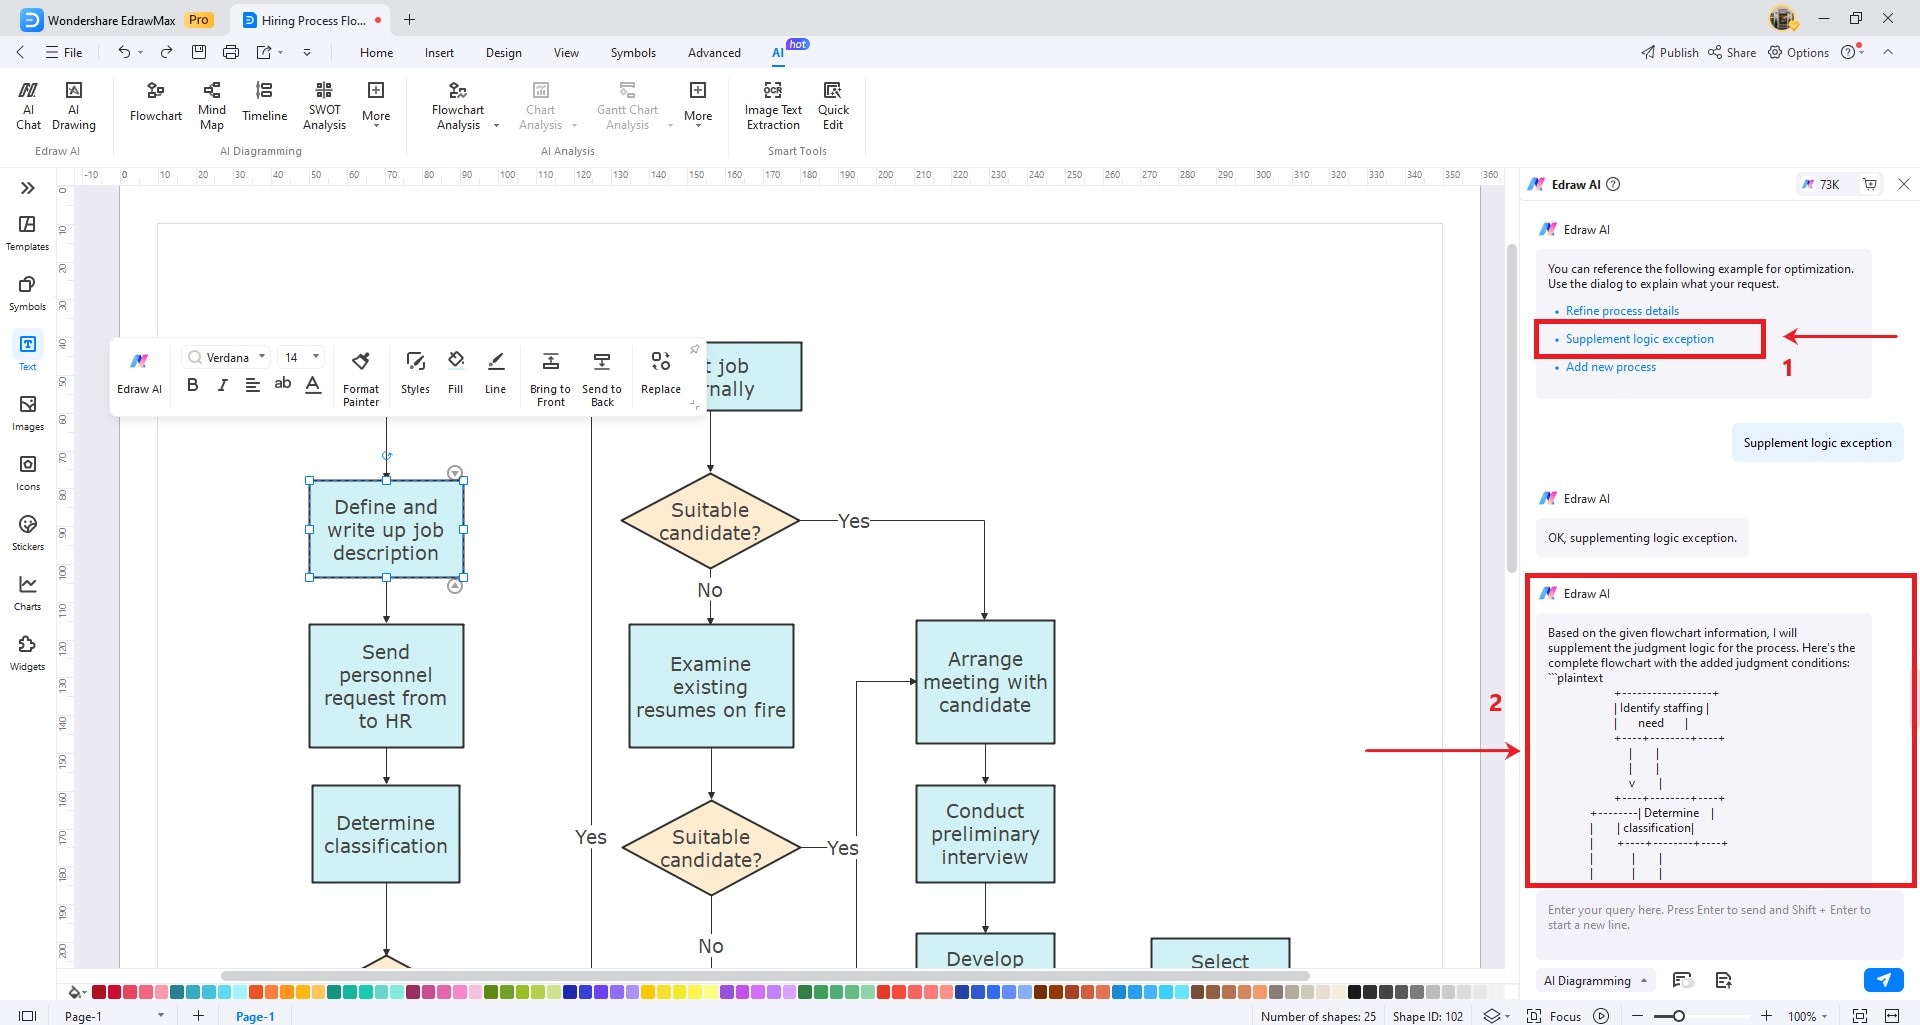
Add New Processes
Write a precise prompt on what kind of new process you would like to add to your flowchart and indicate where you want to incorporate it. Click the Send button and wait until the optimization is complete.
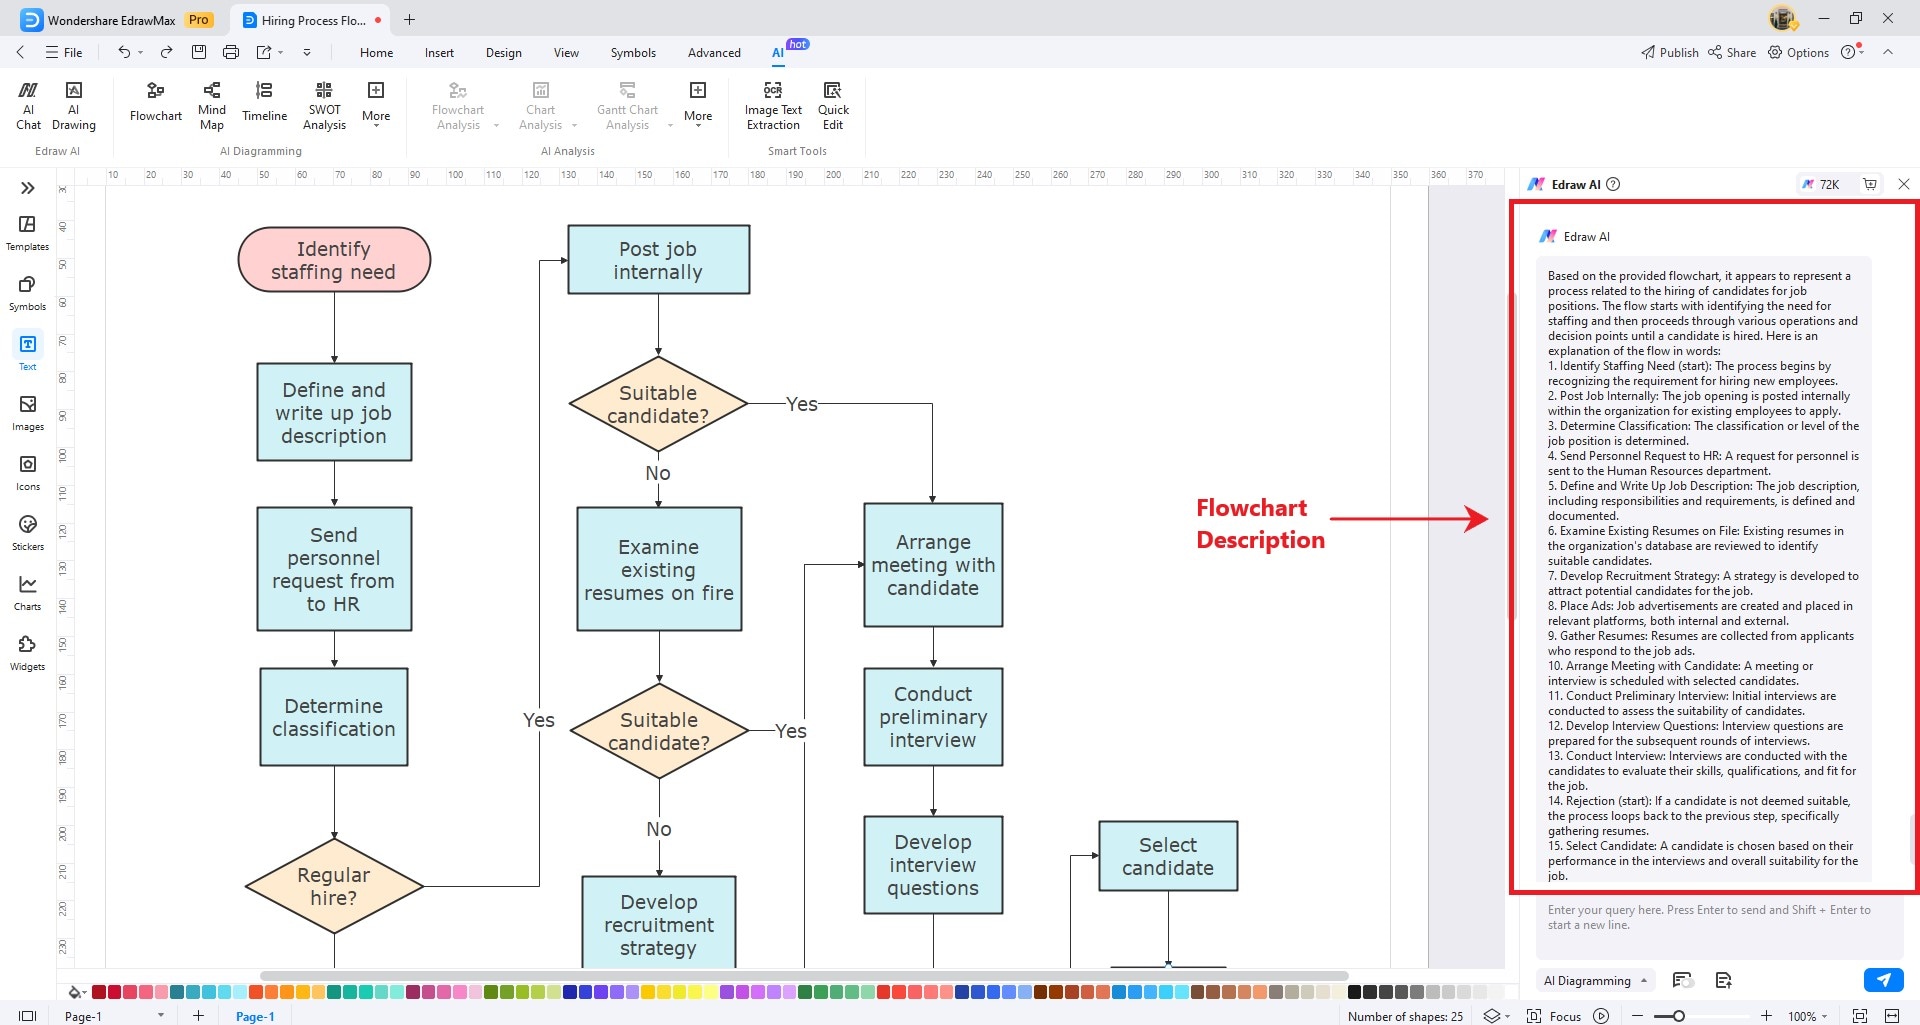
Flowchart Description
The Edraw AI panel will appear on the right side of the screen. It will analyze your flowchart to illustrate its functions and main processes.
AI Gantt Chart Analysis
EdrawMax's Gantt Chart Analysis uses AI to help you understand Gantt charts better. It provides insights into Project Overview, Project Progress, and Lessons Learned. Plus, the Risk Identification option helps identify potential issues and risks you should be aware of.
Right-click on the Gantt Chart to access the floating toolbar. Click Gantt Chart Analysis.
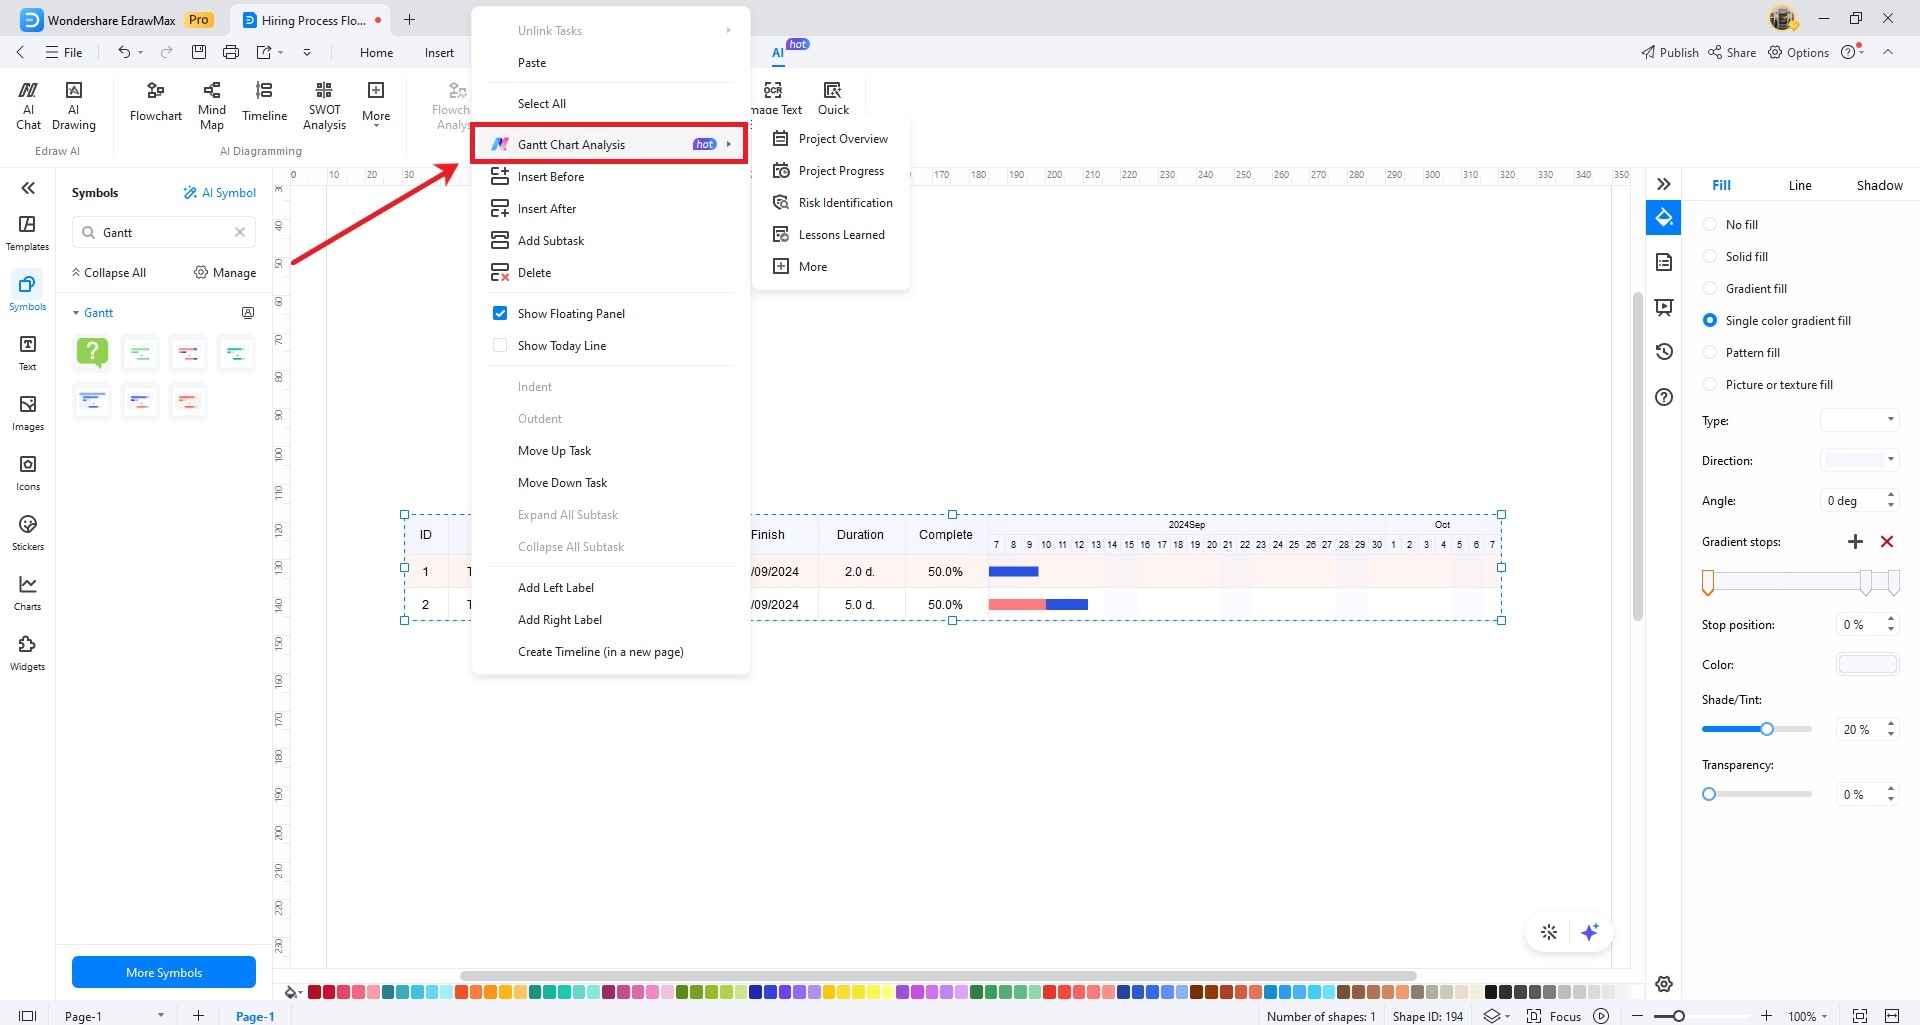
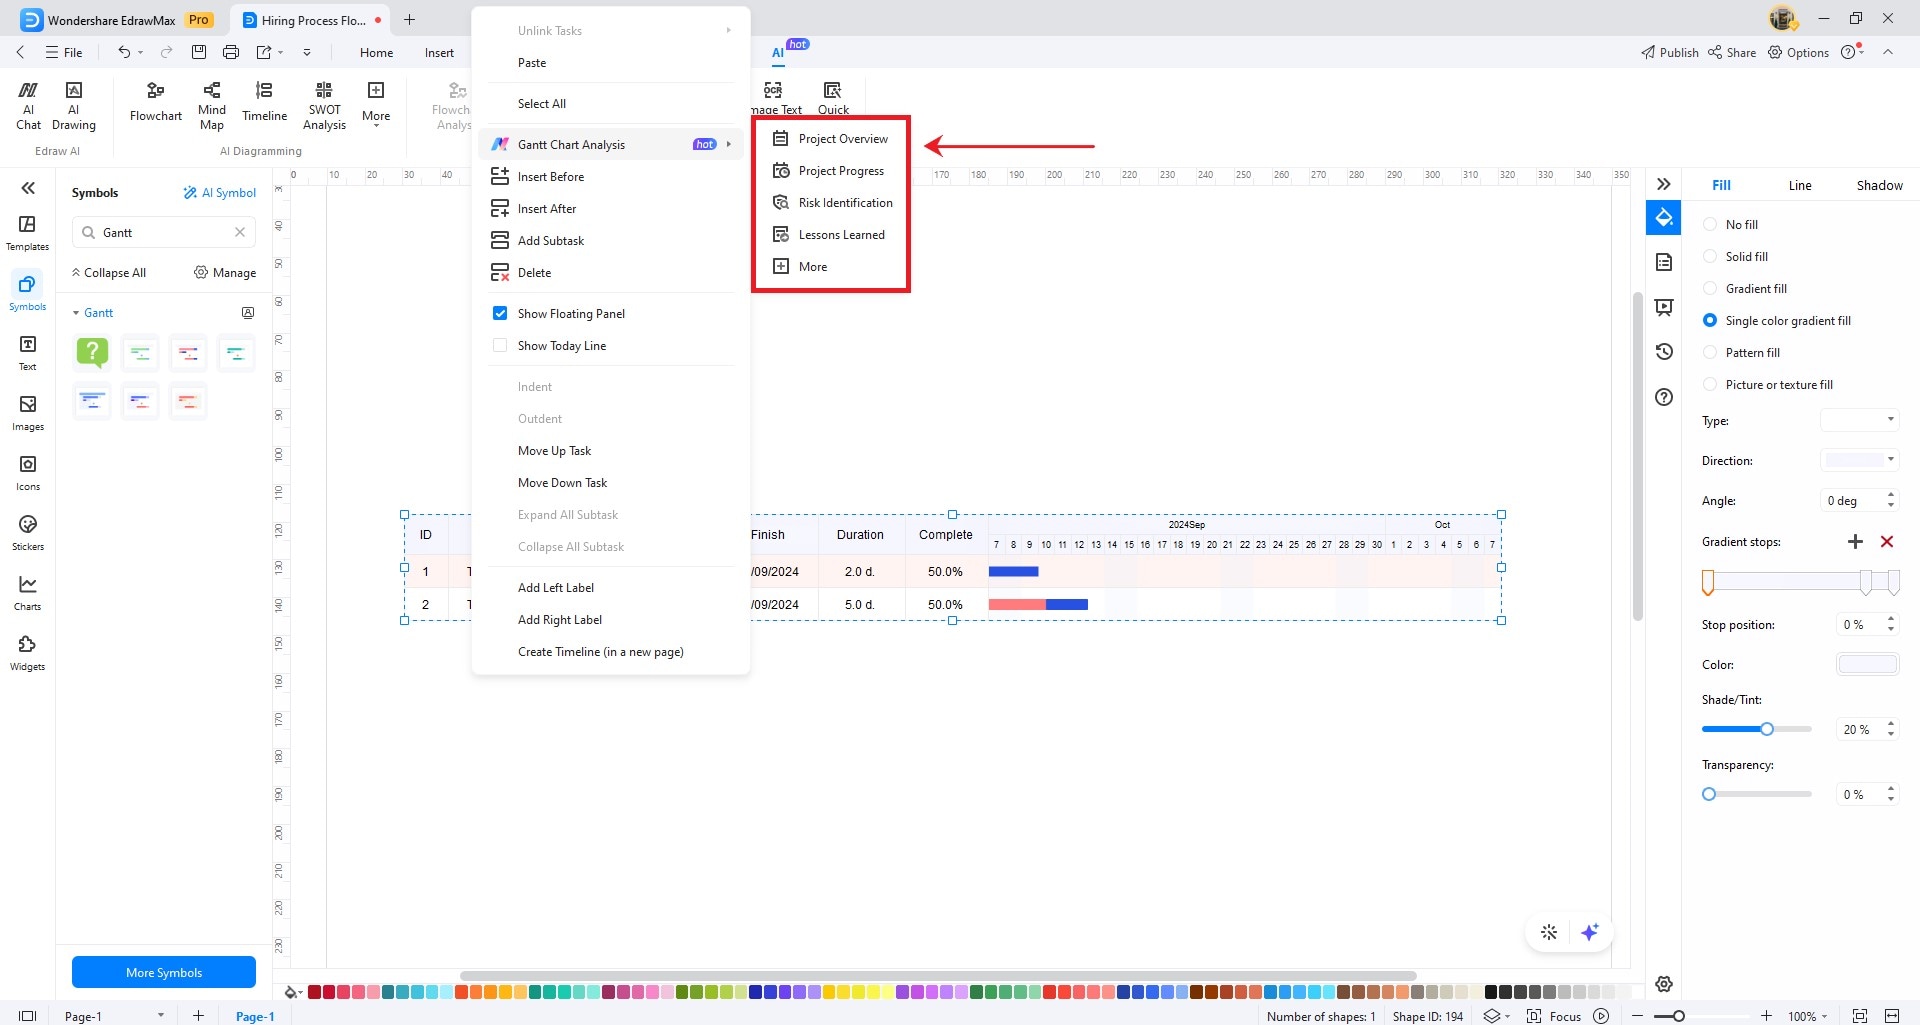
Select one from the four options: Project Overview, Project Progress, Risk Identification, or PLessons Learned.
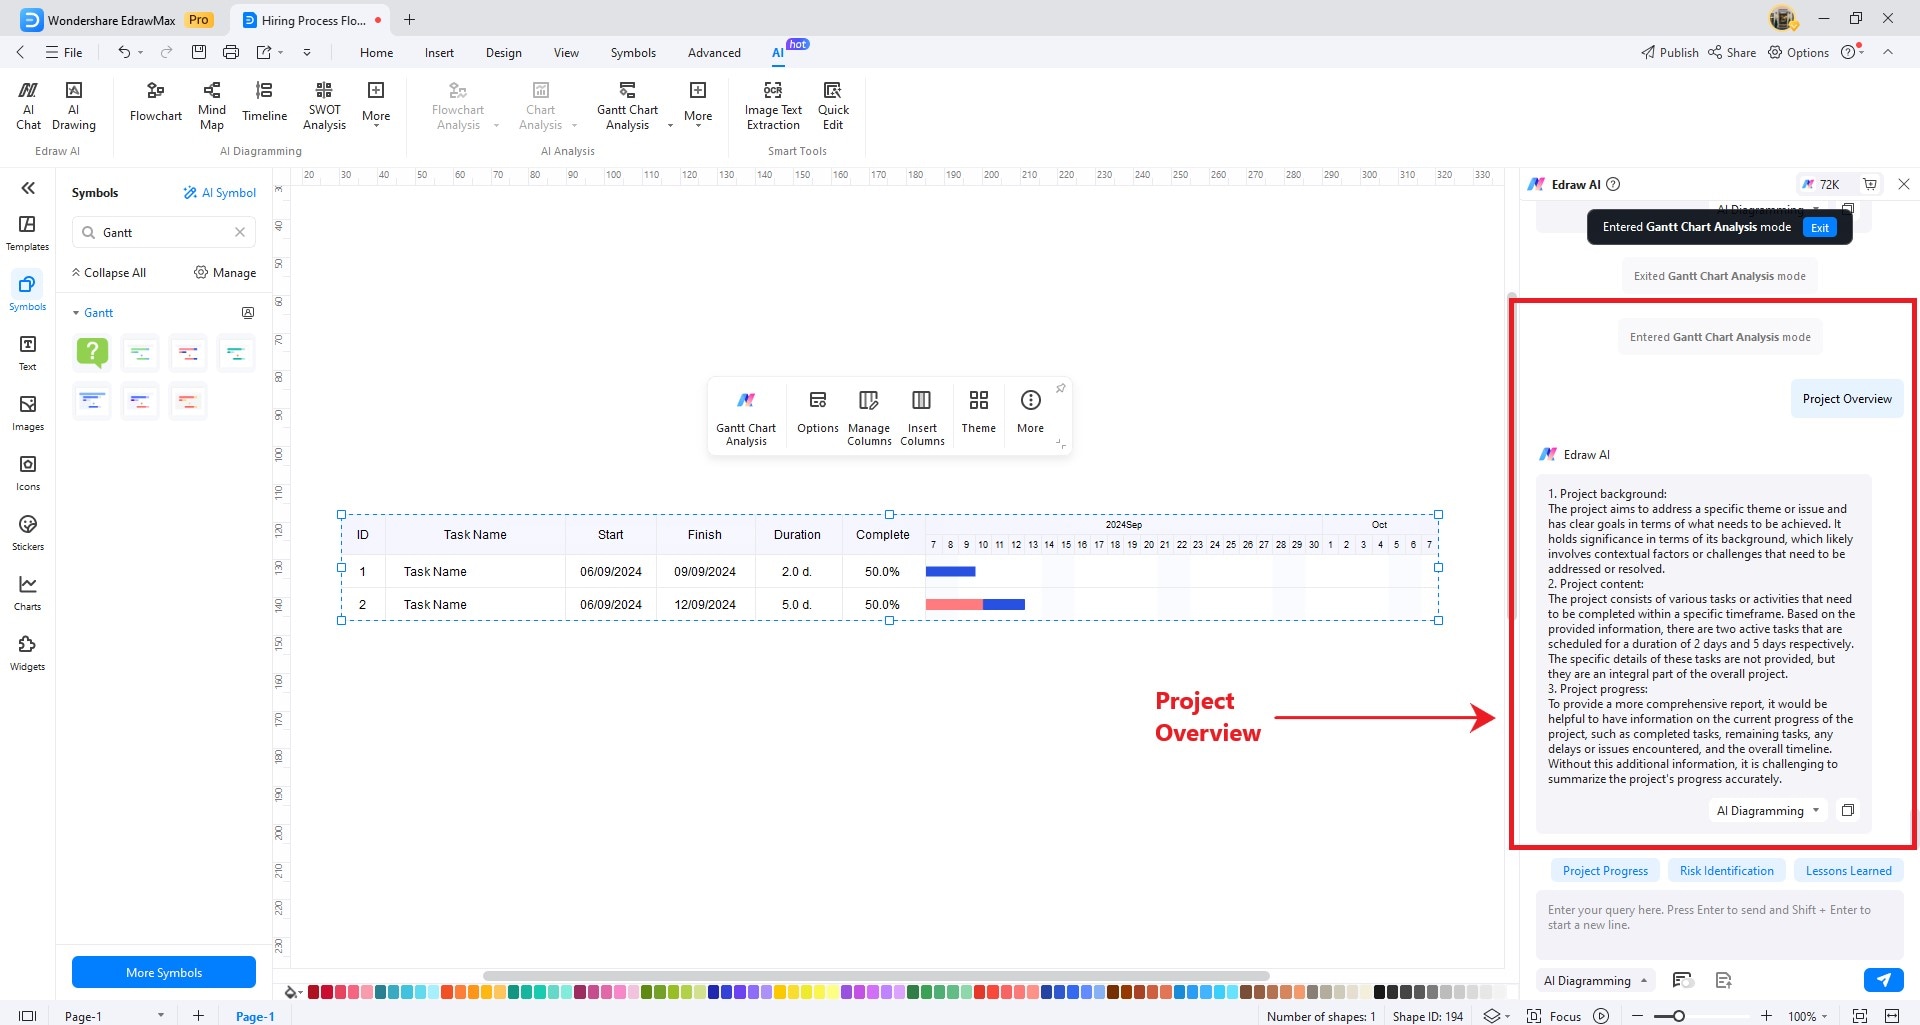
Project Overview
The Edraw AI will appear on the right side of the screen. Wait for the analysis to finish, then you can read the output to learn what the project is about. You will see information about the project background, project content, and the overall assessment.
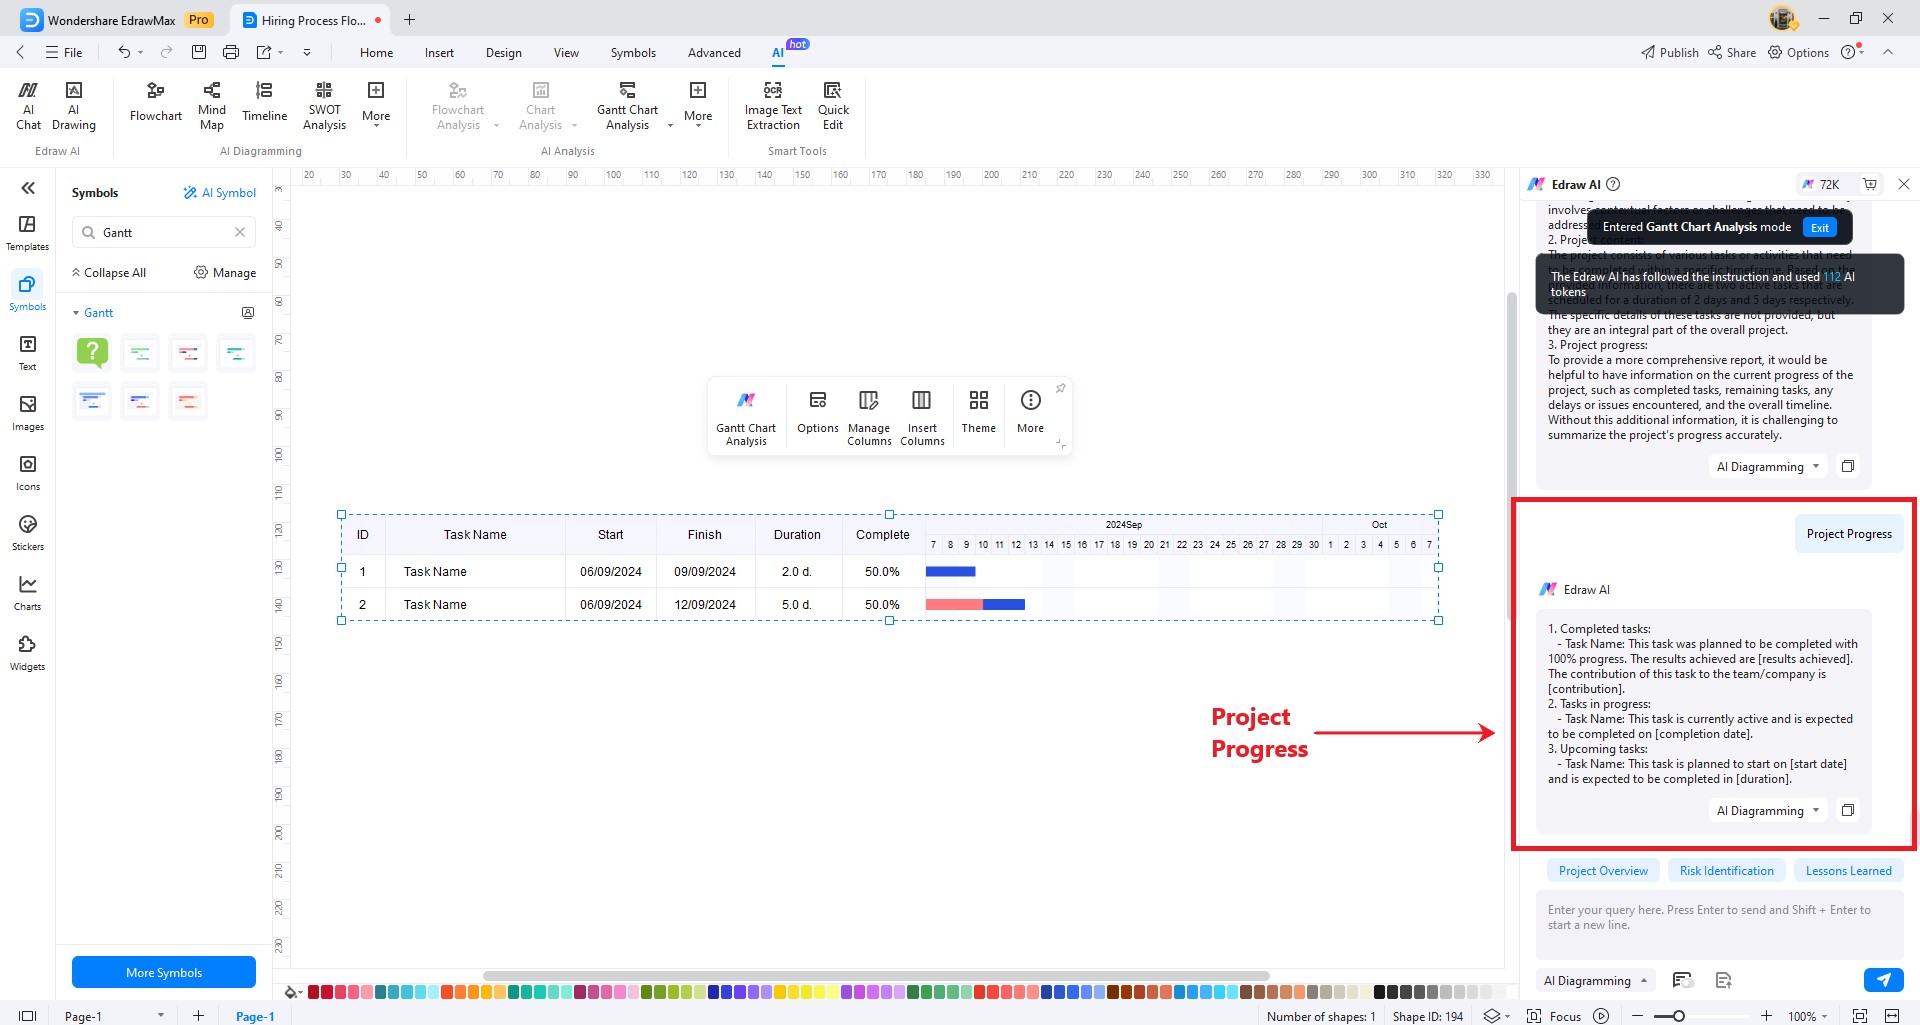
Project Progress
Edraw AI will appear on the right side of the screen. Wait for the analysis to finish, then you can read the output to learn how the project has progressed. You will see a list of completed tasks, tasks in progress, and pending tasks.
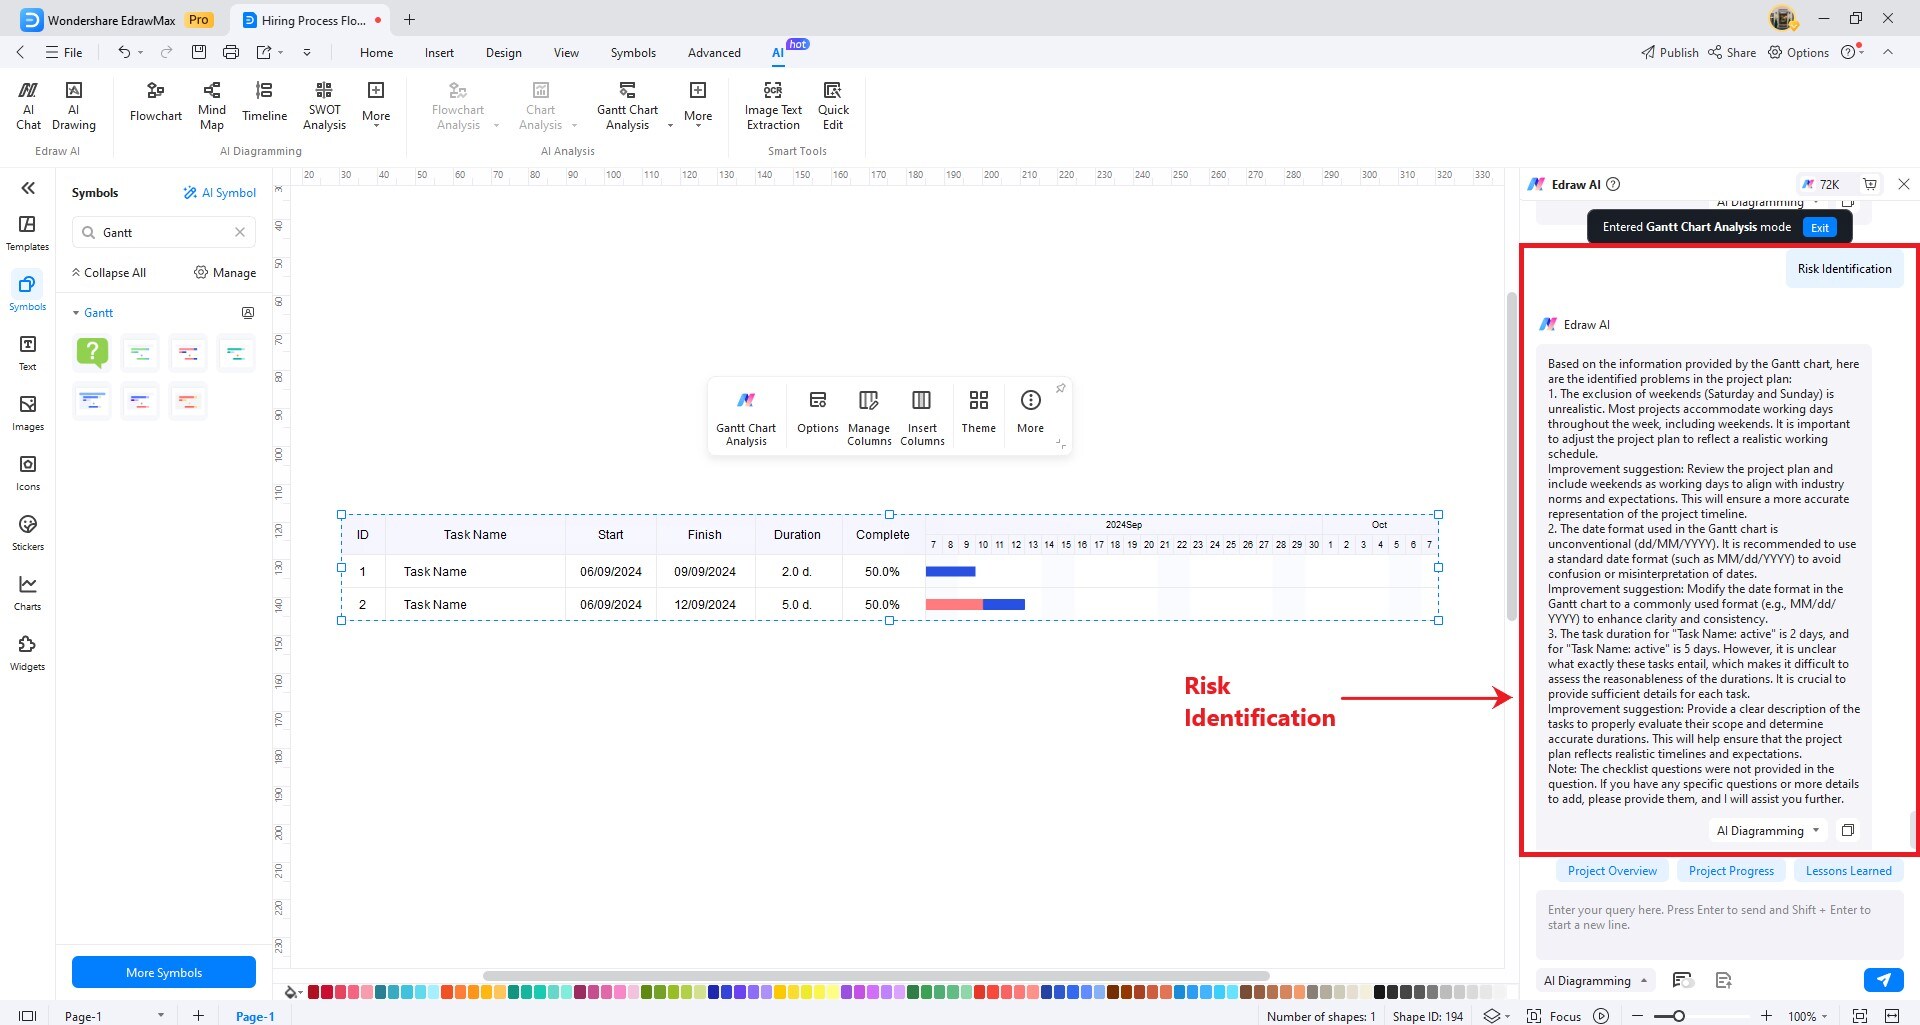
Risk Identification
The Edraw AI will appear on the right side of the screen. Wait for the analysis to finish, then you can read the output to know the risks that you should consider. You will find critical information not currently in the Gantt Chart and the challenges that you may face.
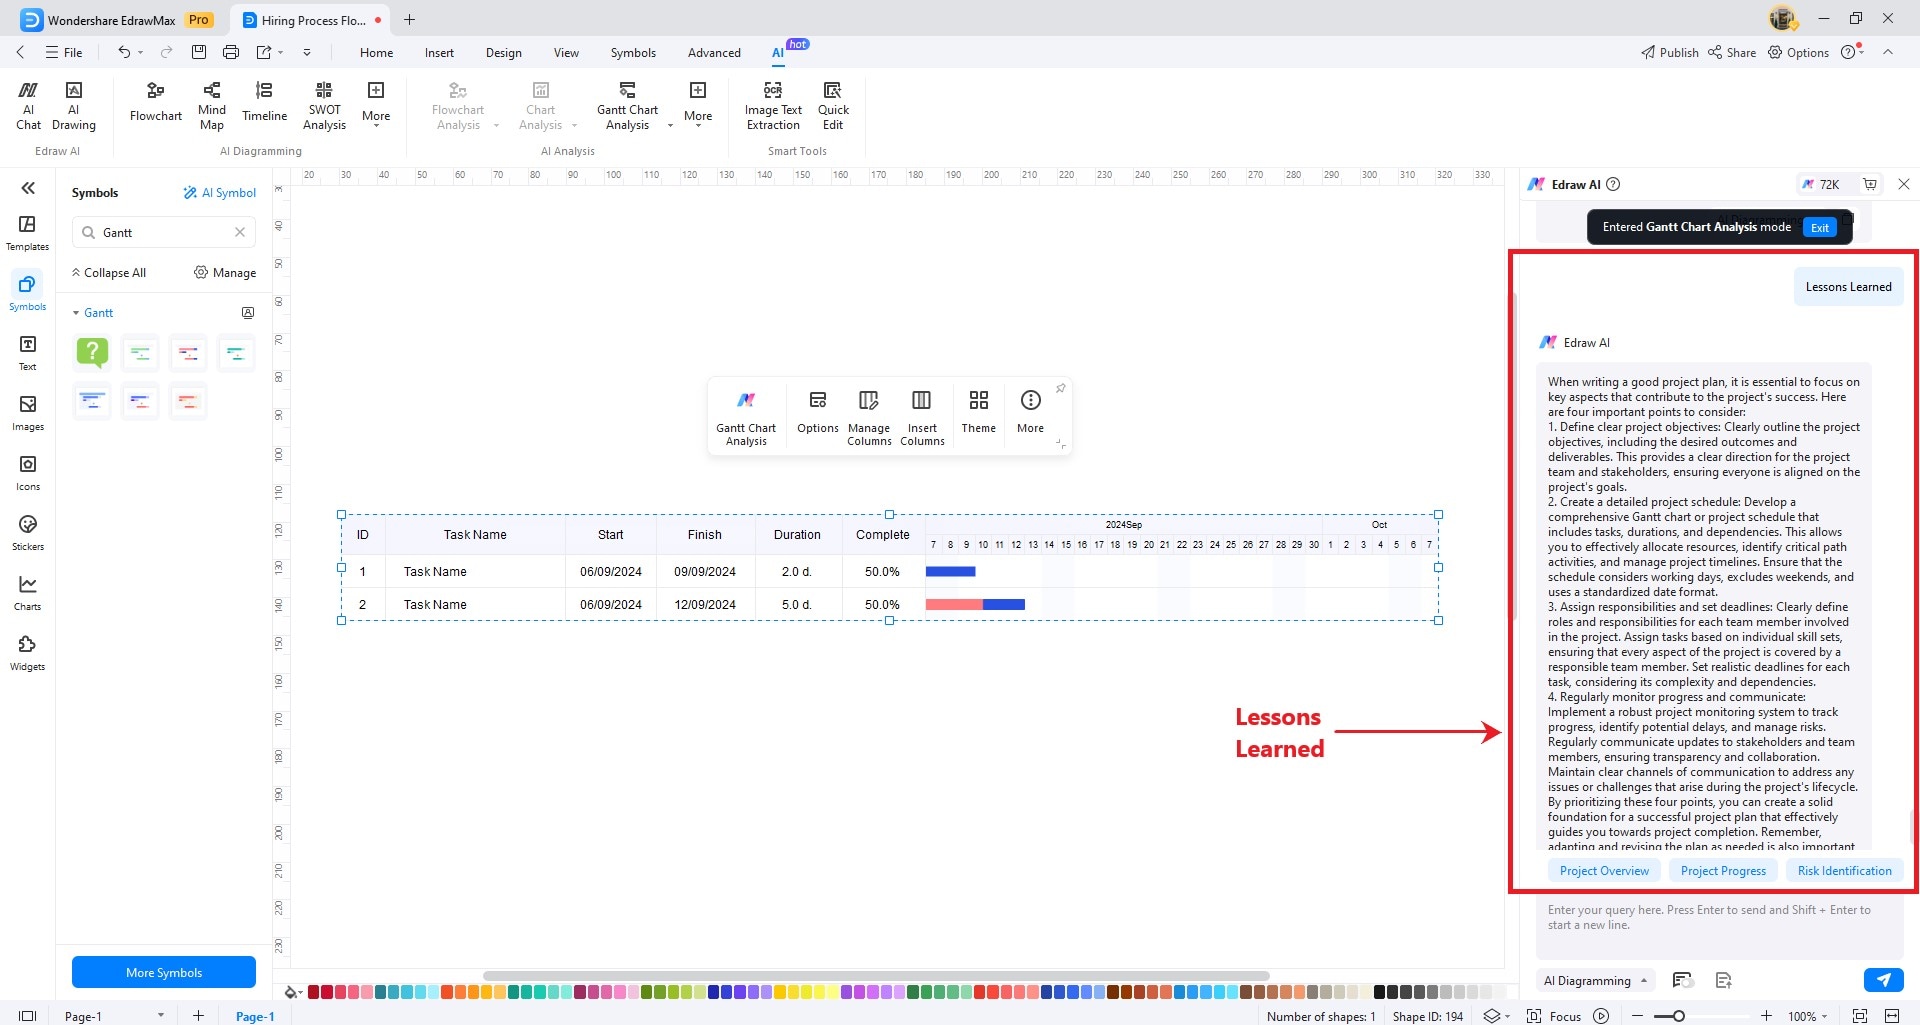
Lessons Learned
The Edraw AI will appear on the right side of the screen. Wait for the analysis to finish. It will show you its findings and provide you with suggestions to improve the Gantt chart.
AI Chart Analysis
Edrawmax’s Chart Analysis feature, powered by Edraw AI, is designed to help you analyze and gain valuable insights from various types of charts. This feature serves multiple purposes, including Data Comparison, Abnormality Identification, Summary Generation, and Trend Prediction. Here's how to use the Chart Analysis feature in Edrawmax:
Go to the AI tab on the top toolbar. Click the Chart Analysis button and choose the type of analysis you want to perform.
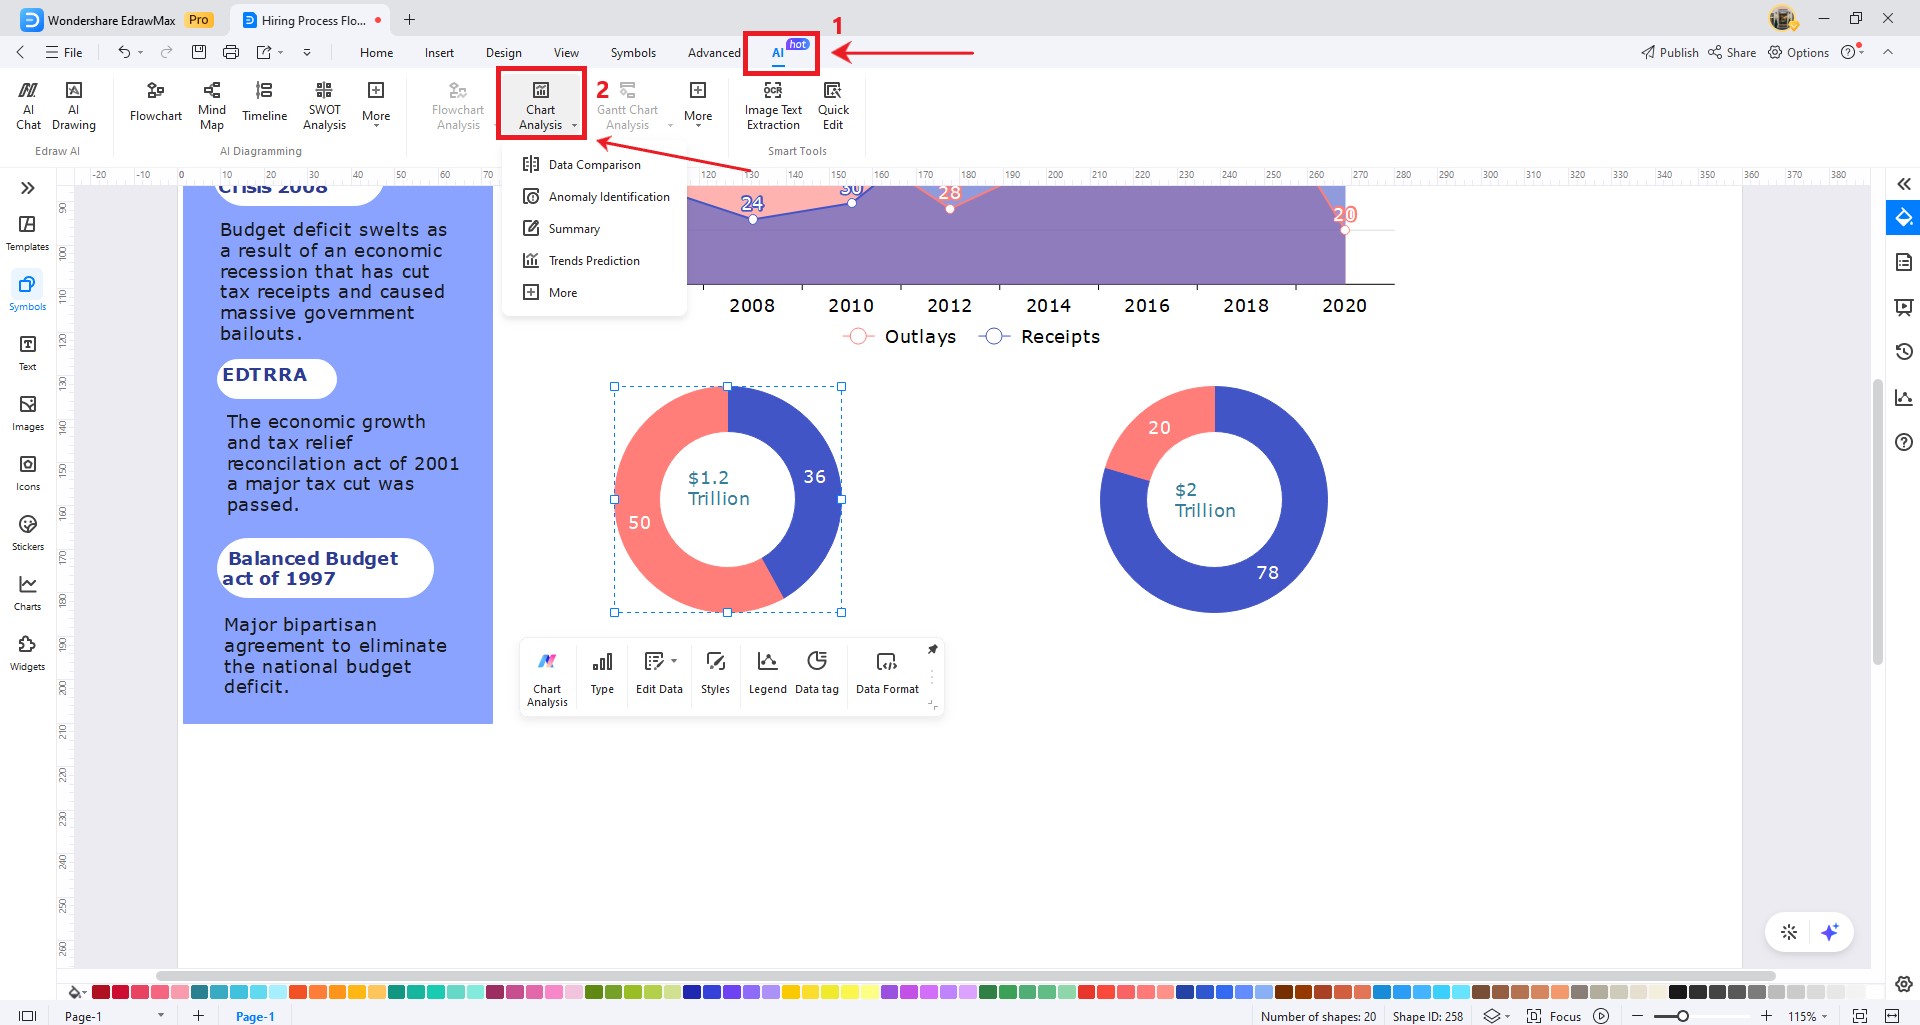
Another option is to access the floating toolbar by right-clicking on the chart. Click on Chart Analysis and choose the desired type of analysis to initiate the process.
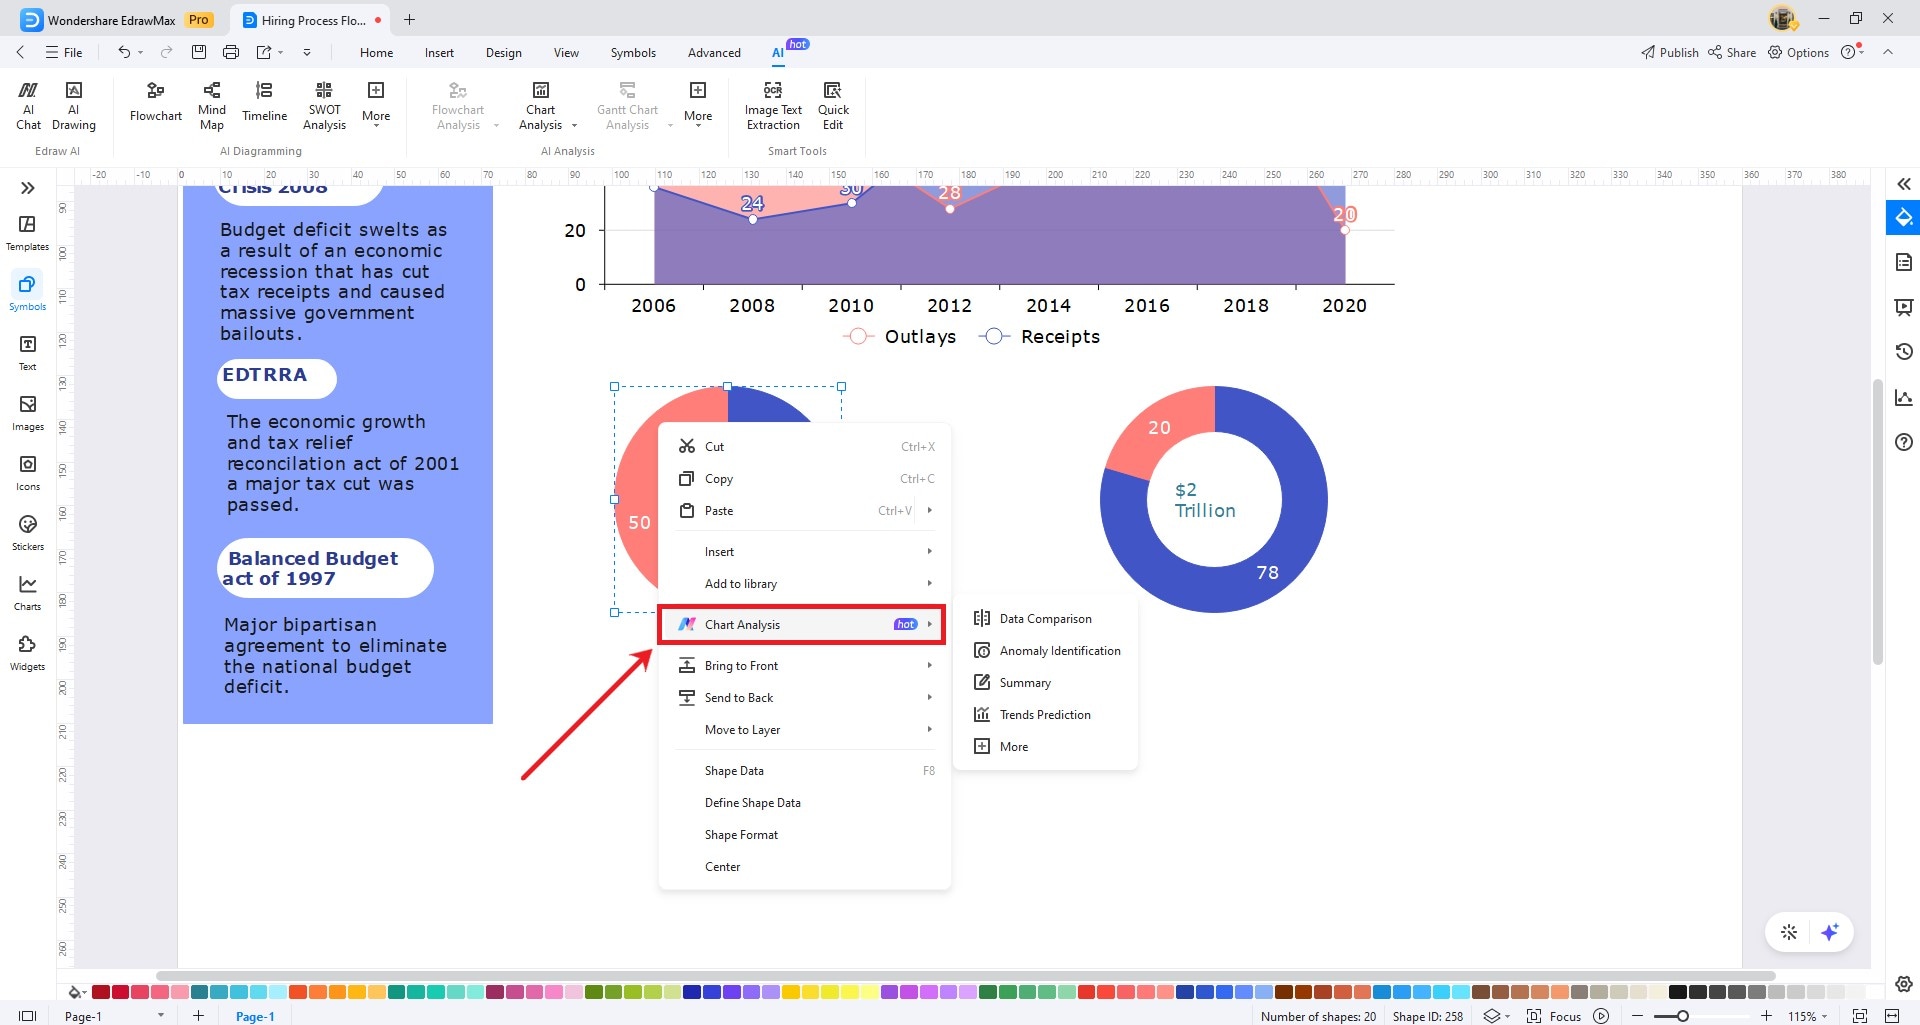
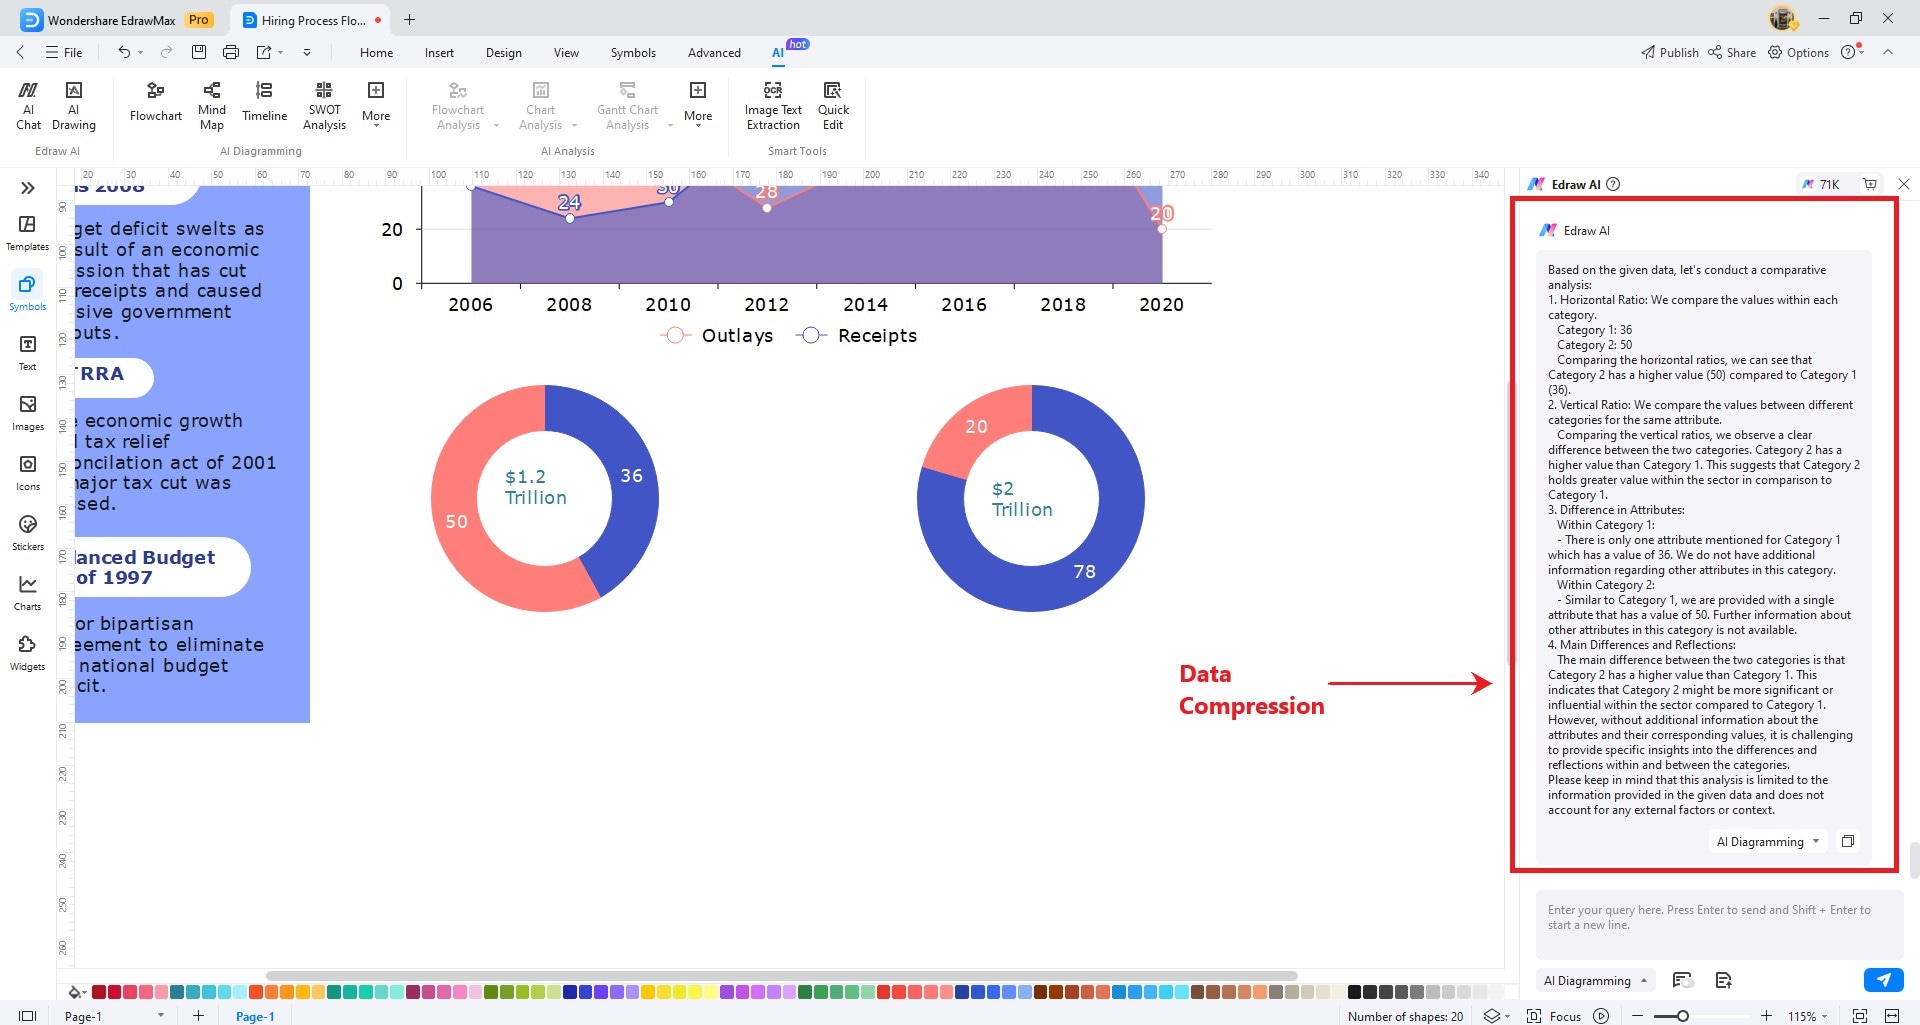
Data Comparison
The Edraw AI panel will appear on the right side of the screen. It will now analyze your chart and will compare data from different dimensions within the chart.
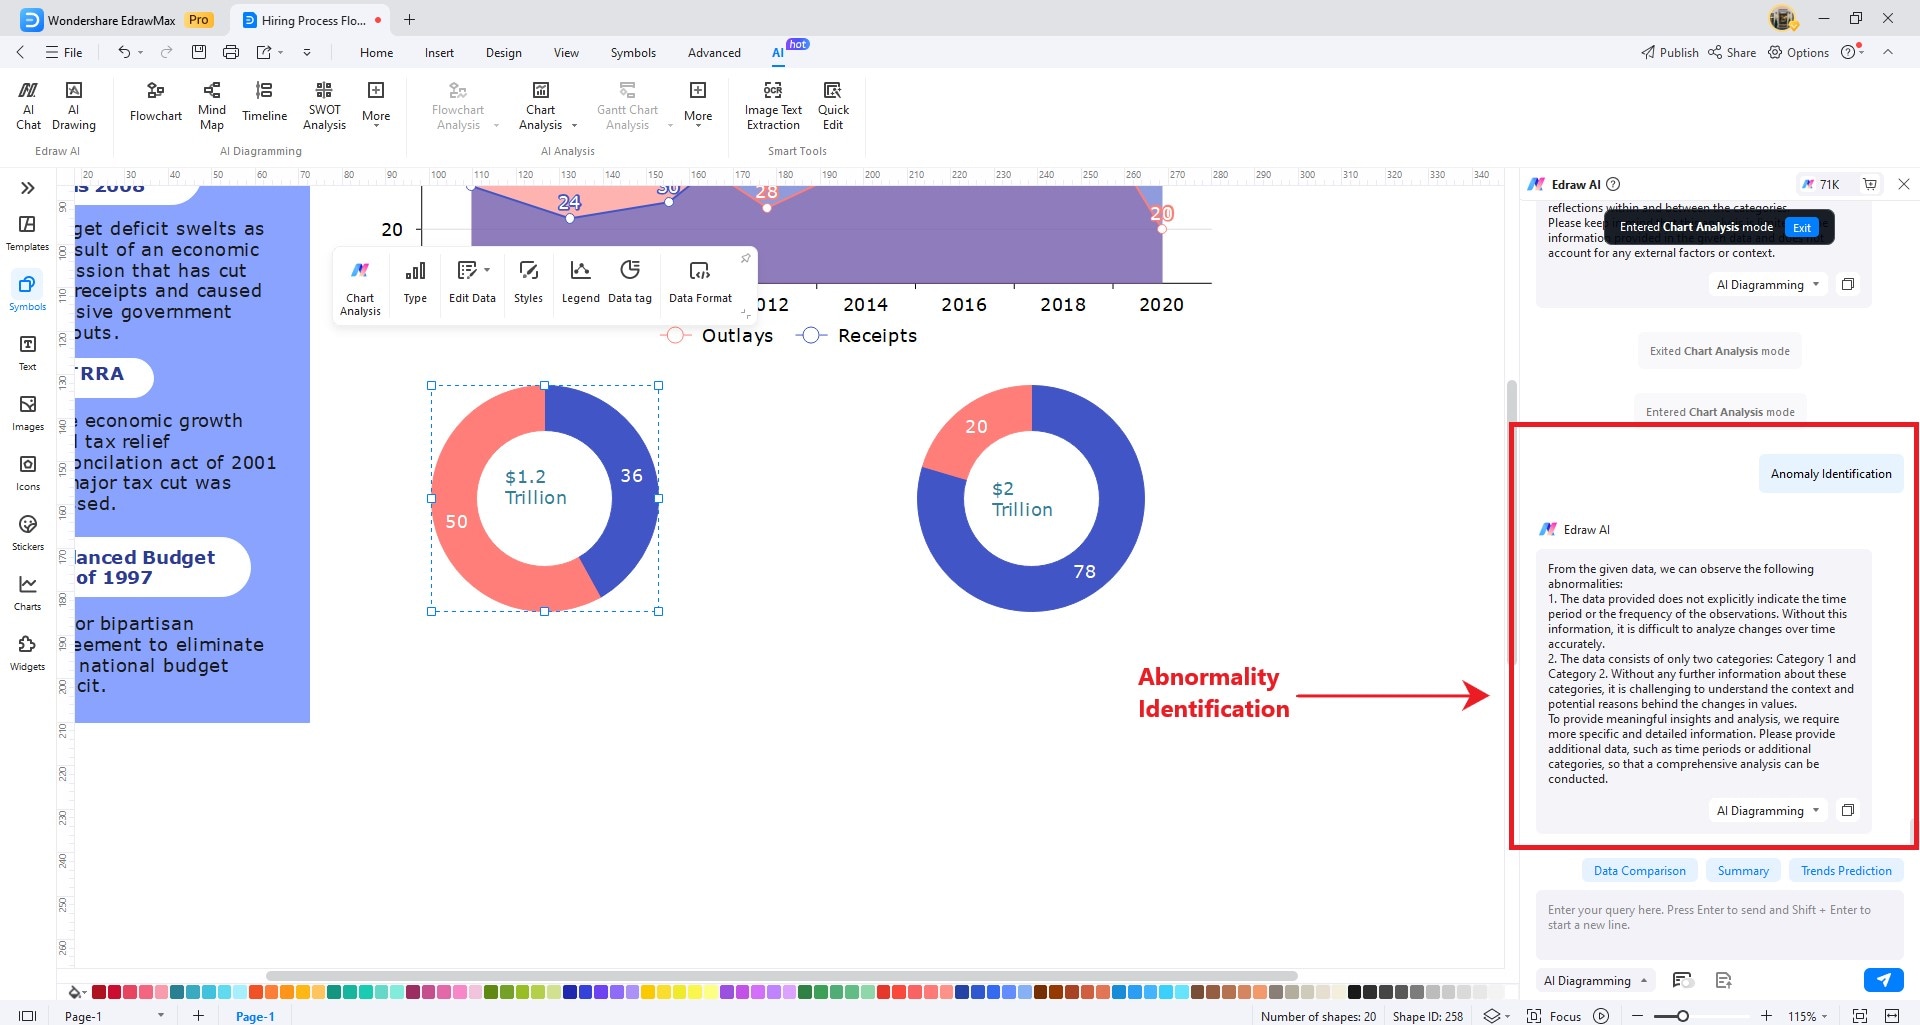
Abnormality Identification
The Edraw AI panel will appear on the right side of the screen. It will now analyze your chart and will automatically identify potential abnormalities within your chart.
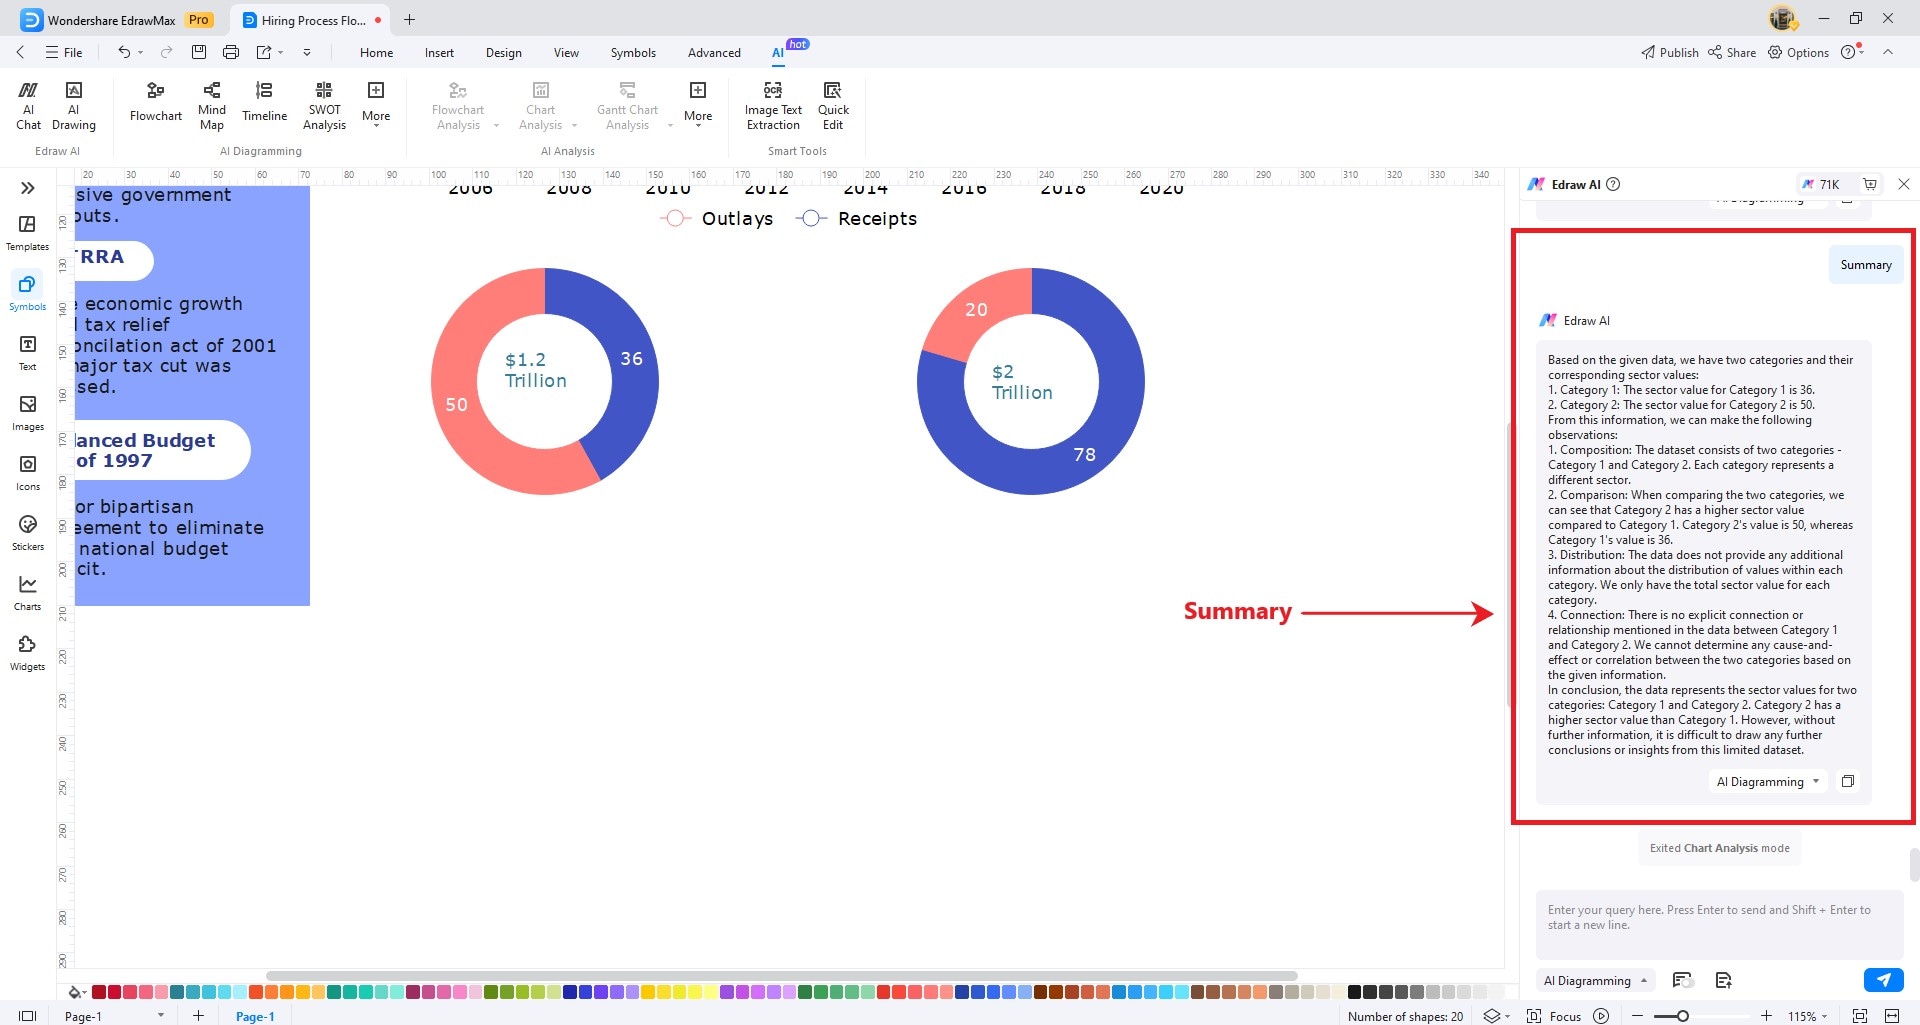
Summary
The Edraw AI panel will appear on the right side of the screen. It will now analyze your chart and generate a multi-dimensional summary of your chart data, including data composition, comparison, distribution, and connection.
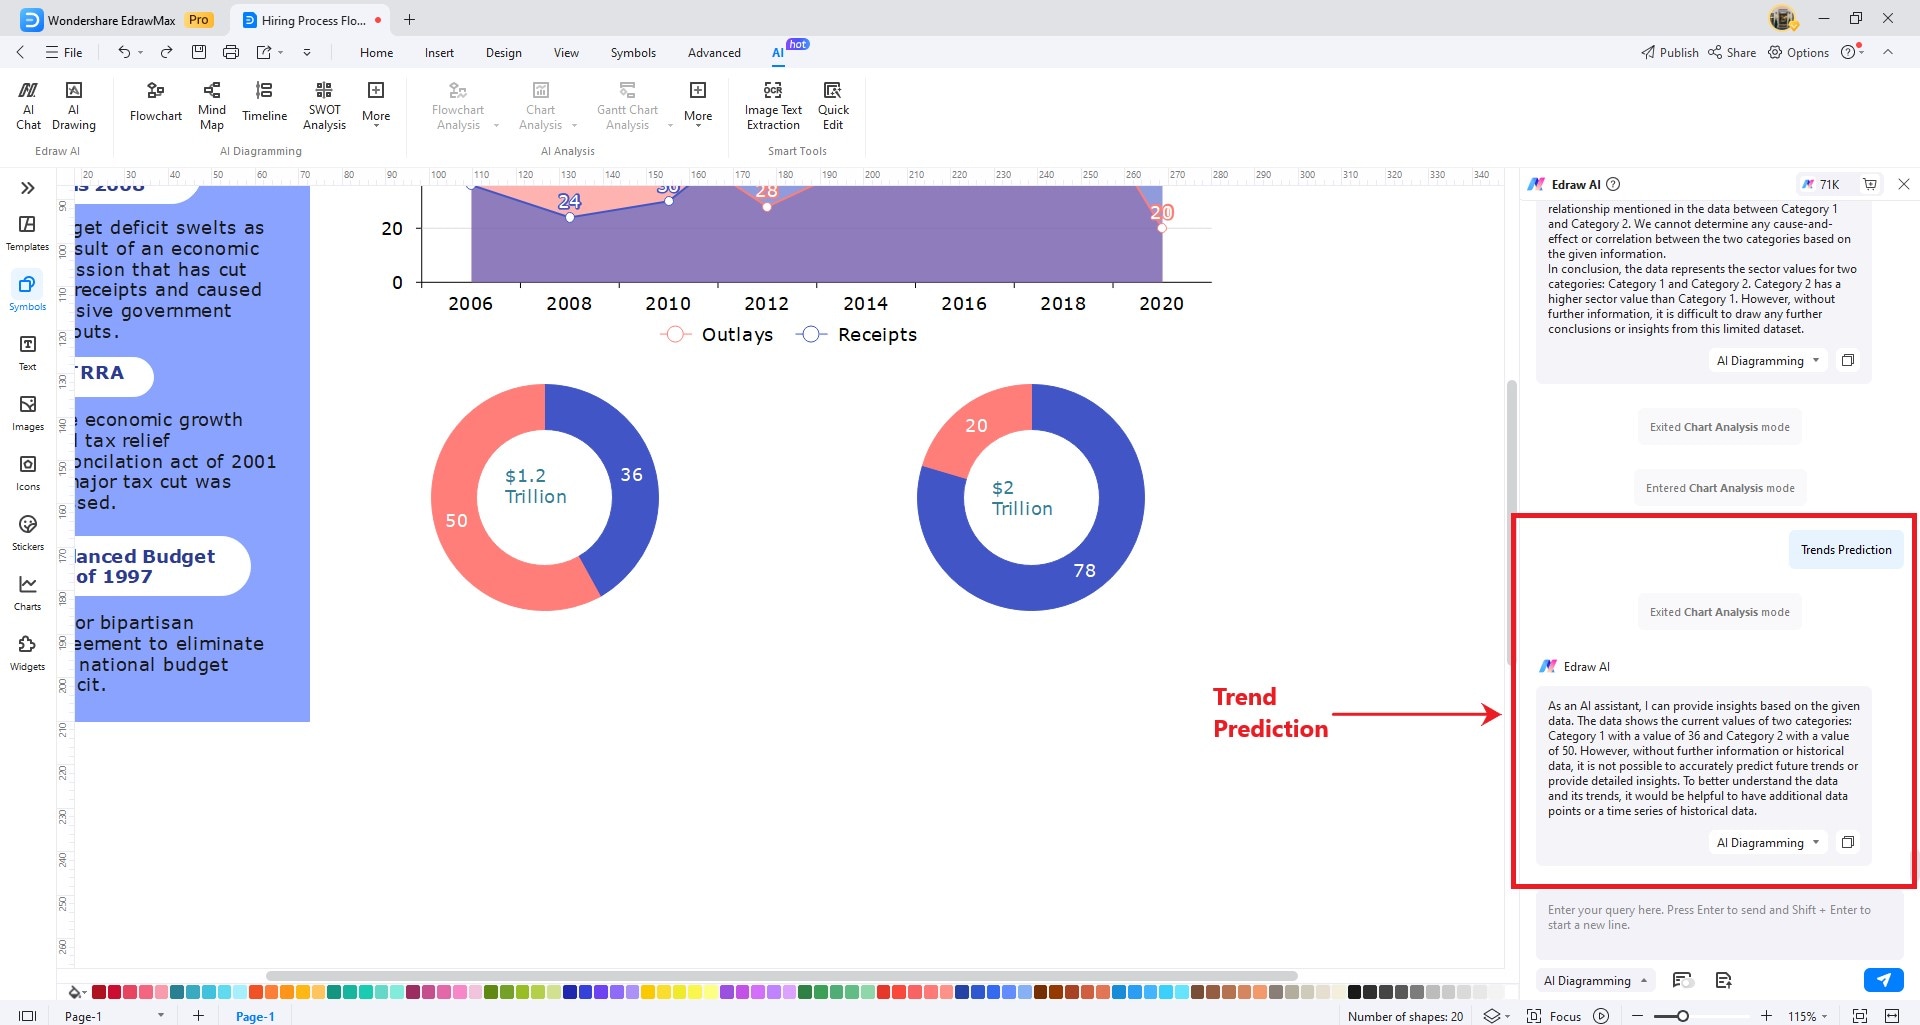
Trend Prediction
The Edraw AI panel will appear on the right side of the screen. It will now analyze historical chart data and give you insights into business trends.
AI Table Analysis
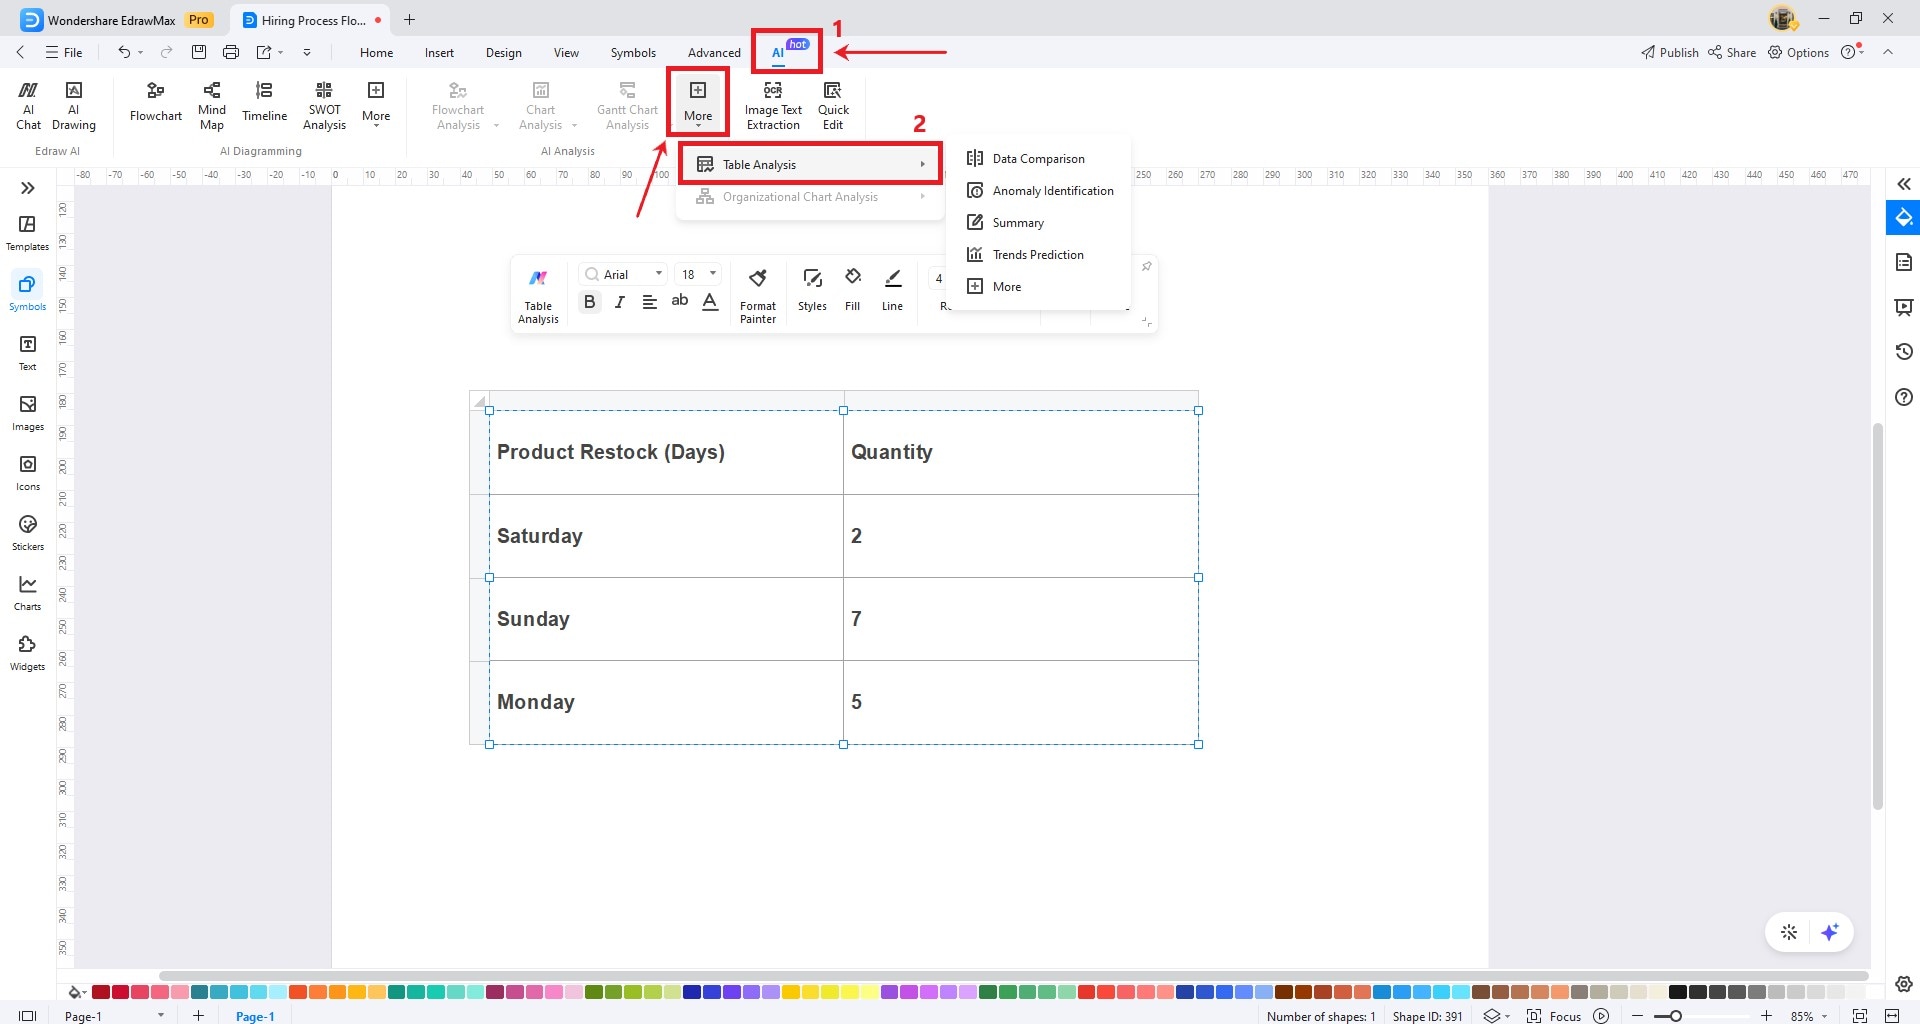
Edrawmax's Table Analysis feature uses AI to help you analyze and extract valuable insights from your data tables. This feature serves various purposes, such as Data Comparison, Abnormaly Identification, Summary Generation, Trend Prediction. Here's how:
Go to the AI tab on the top toolbar. Click the Table Analysis button and choose the type of analysis you want to perform.
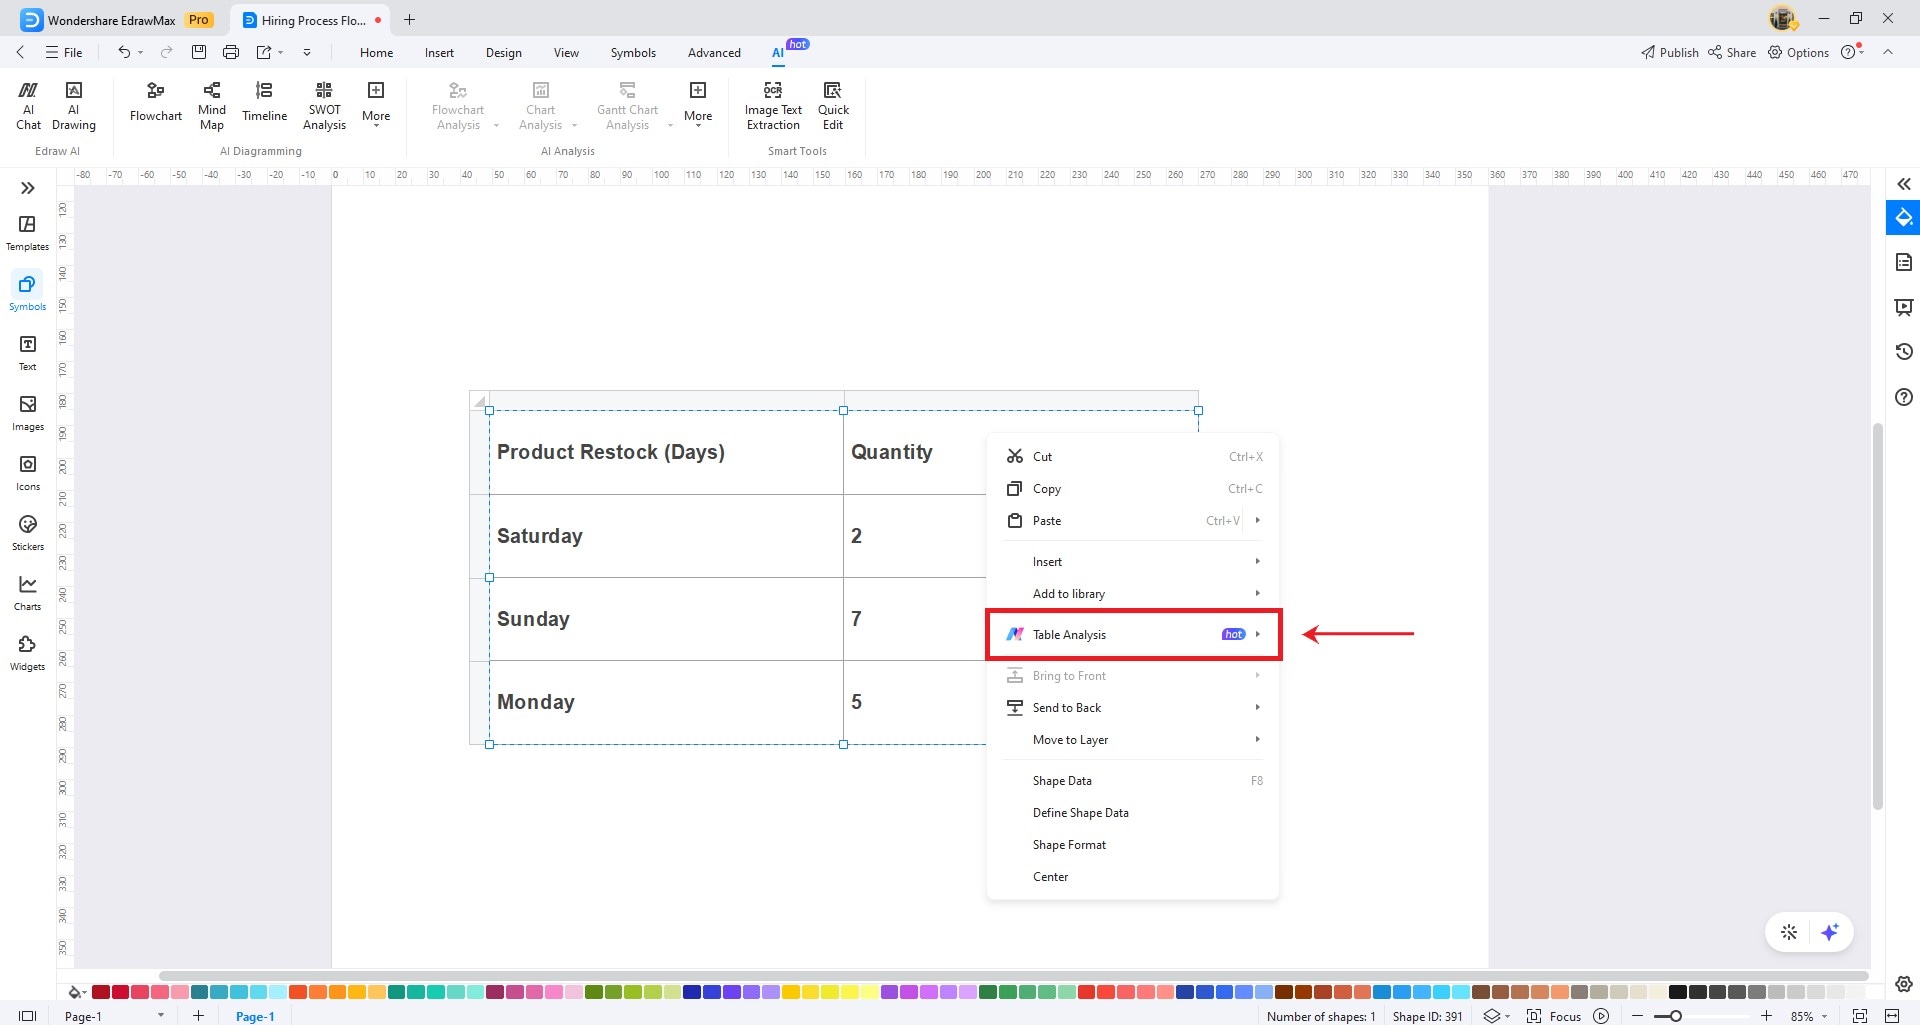
Another option is to access the floating toolbar by right-clicking on the table. Click on Table Analysis and choose the desired type of analysis to initiate the process.
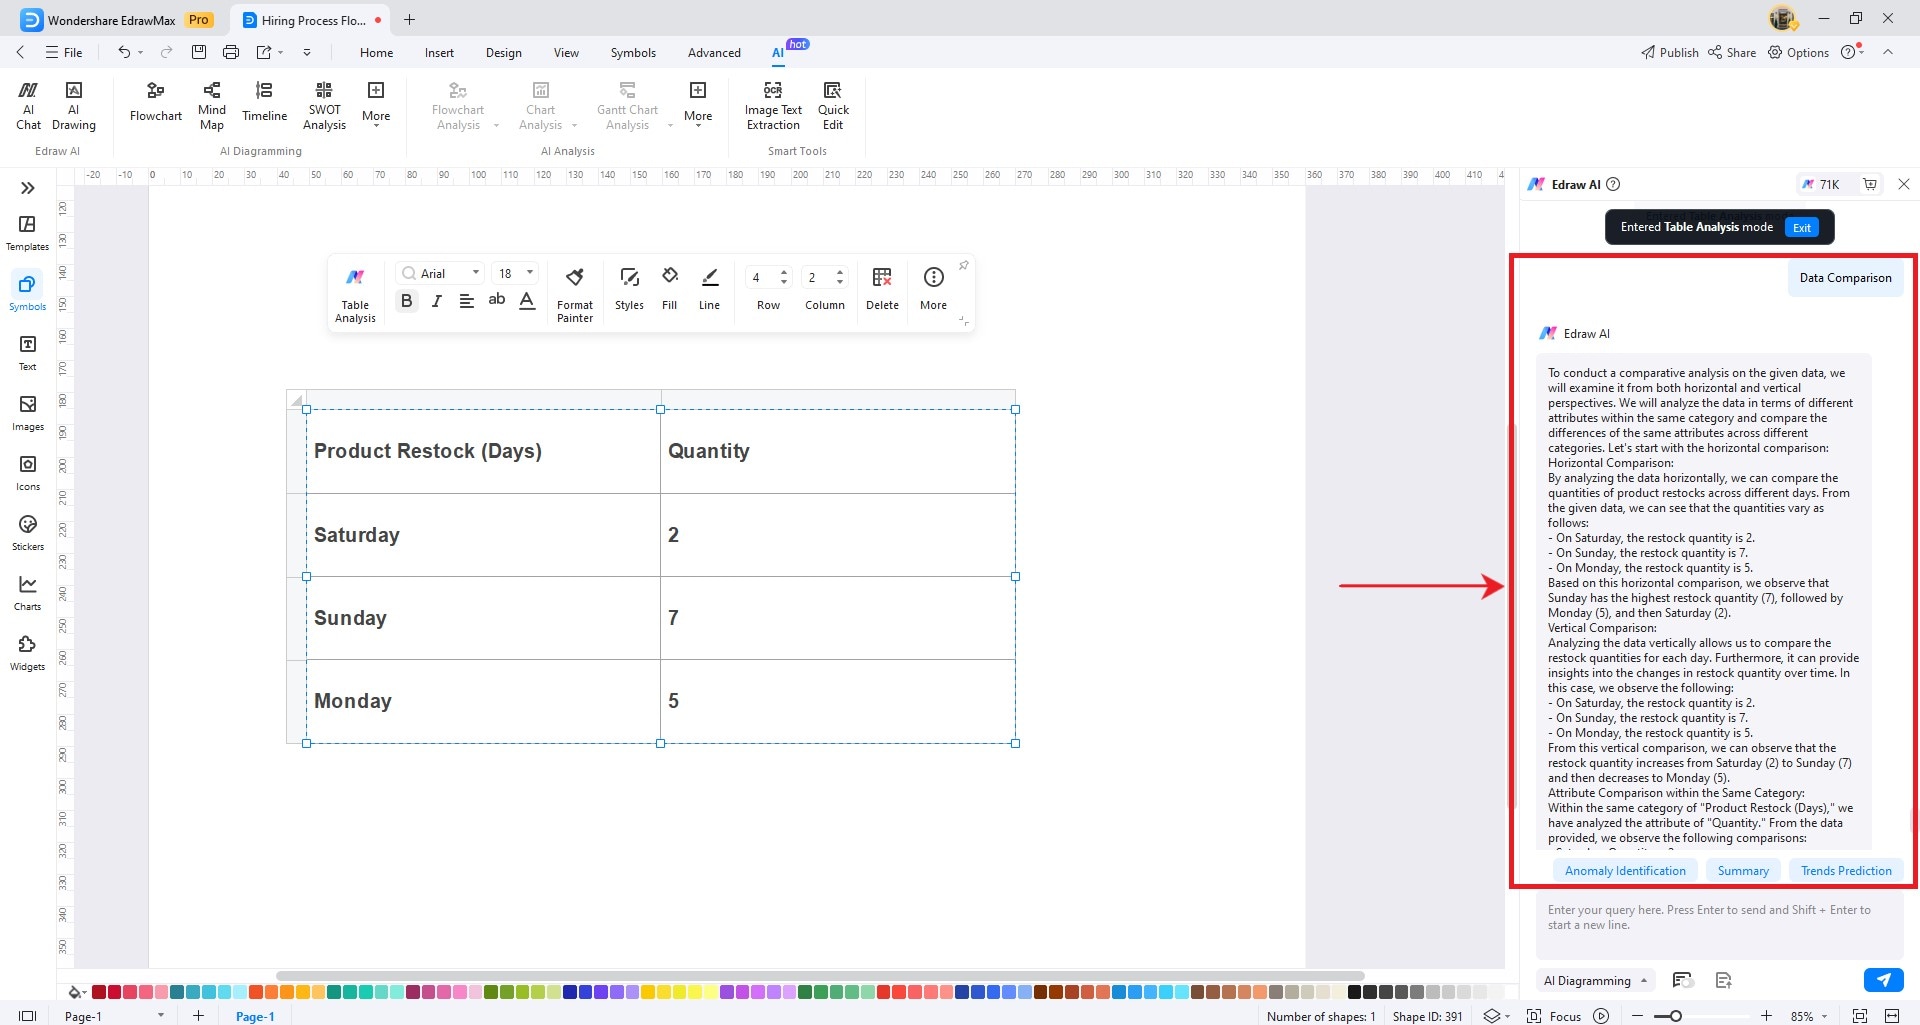
Data Comparison
The Edraw AI panel will appear on the right side of the screen. It will now analyze your table and will compare data from multiple tables.
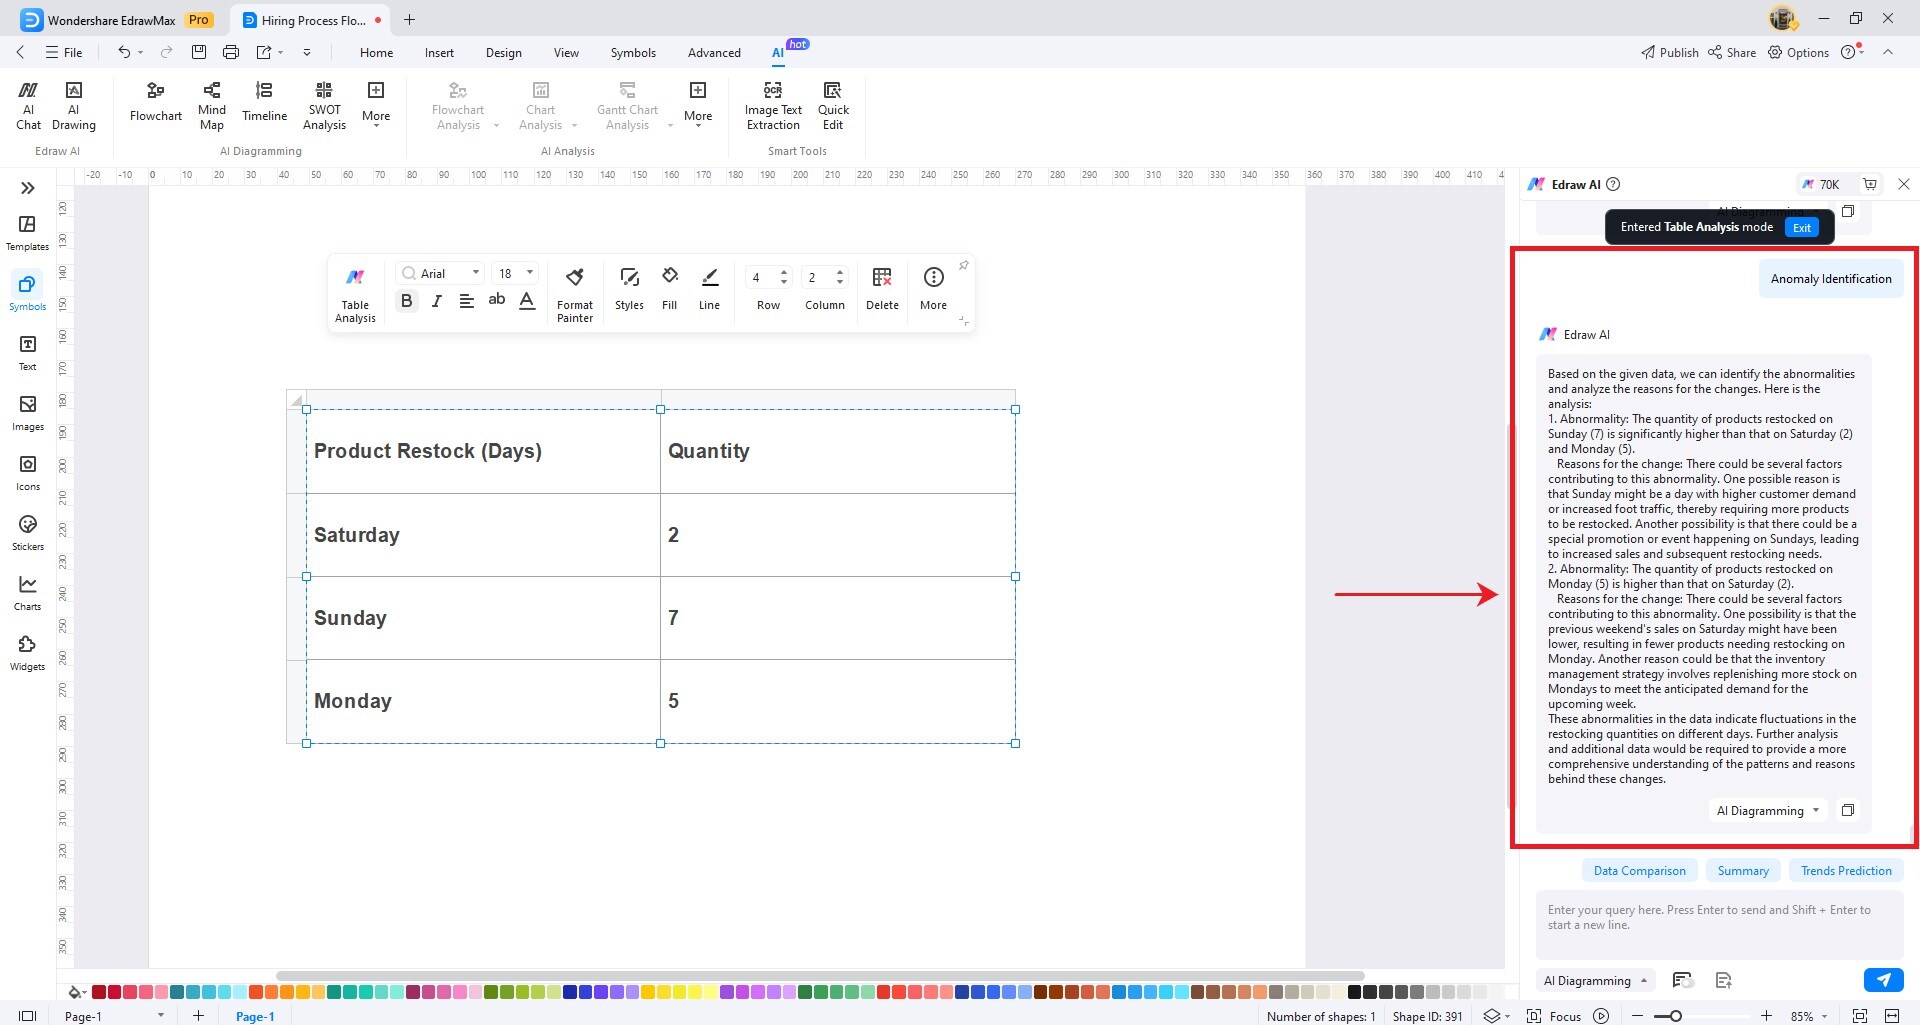
Anomaly Identification
The Edraw AI panel will appear on the right side of the screen. It will now analyze your chart and automatically identify potential anomalies within your data tables.
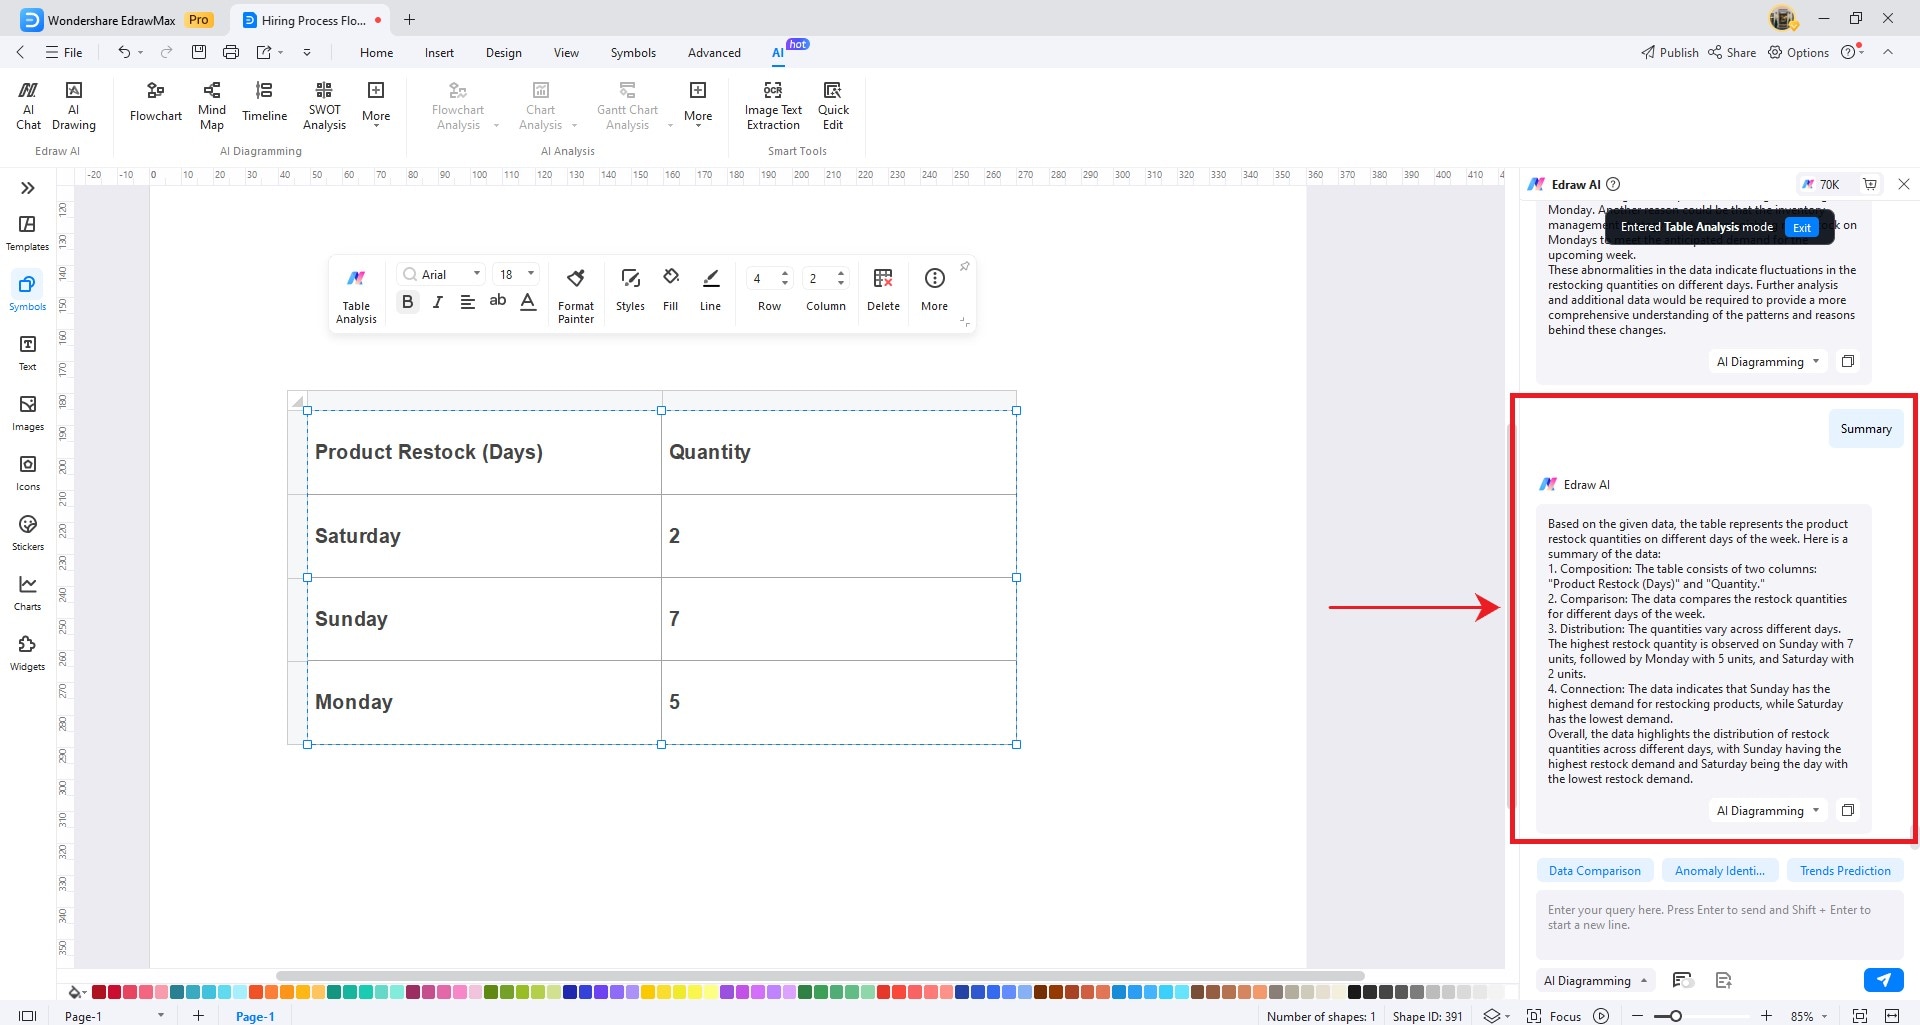
Summary
The Edraw AI panel will appear on the right side of the screen. It will now analyze your chart and generate summary statistics for your data tables.
Trend Prediction
The Edraw AI panel will appear on the right side of the screen. It will now analyze historical data patterns to give you future predictions and business insights.
