EdrawMax User Guide for Desktop
-
Get Started with EdrawMax
-
User Interface
-
Basic Operations
-
Advanced Operations
-
Shape Operations
-
Drawing Tools
-
Formatting and Styling
-
Text Operations
-
Symbol and Library
-
Insert/Add Objects
-
Page Settings
-
Presentation Mode
-
AI Features
- How to Make a Diagram with Edraw AI
- AI Slides
- AI Infographics Generator
- AI Copywriting
- AI Stickers
- AI Symbols
- AI Analysis
- AI Drawing
- AI OCR
- EdrawMax Quotation Tool
- AI Diagram Generator
- AI Framework Generator
- EdrawMax AI Copilot
- AI Chatbot
- AI Flowchart
- AI Mind Map
- AI Timeline
- AI Table
- AI List
- AI SWOT Analysis, PEST Analysis, and Lean Canvas
- AI User Profile
-
How to Make a Flowchart
-
How to make an Org Chart
-
How to make a Gantt Chart
-
How to Make a Mind Map
-
More examples
Create a Gantt Chart from Data
EdrawMax allows users to create a Gantt Chart from data stored in Excel, CSV, and TXT files. Refer to the guide below to get started in simple and easy steps.
Step 1: Find and click New on the left panel and select Gantt Chart from the expanded menu.

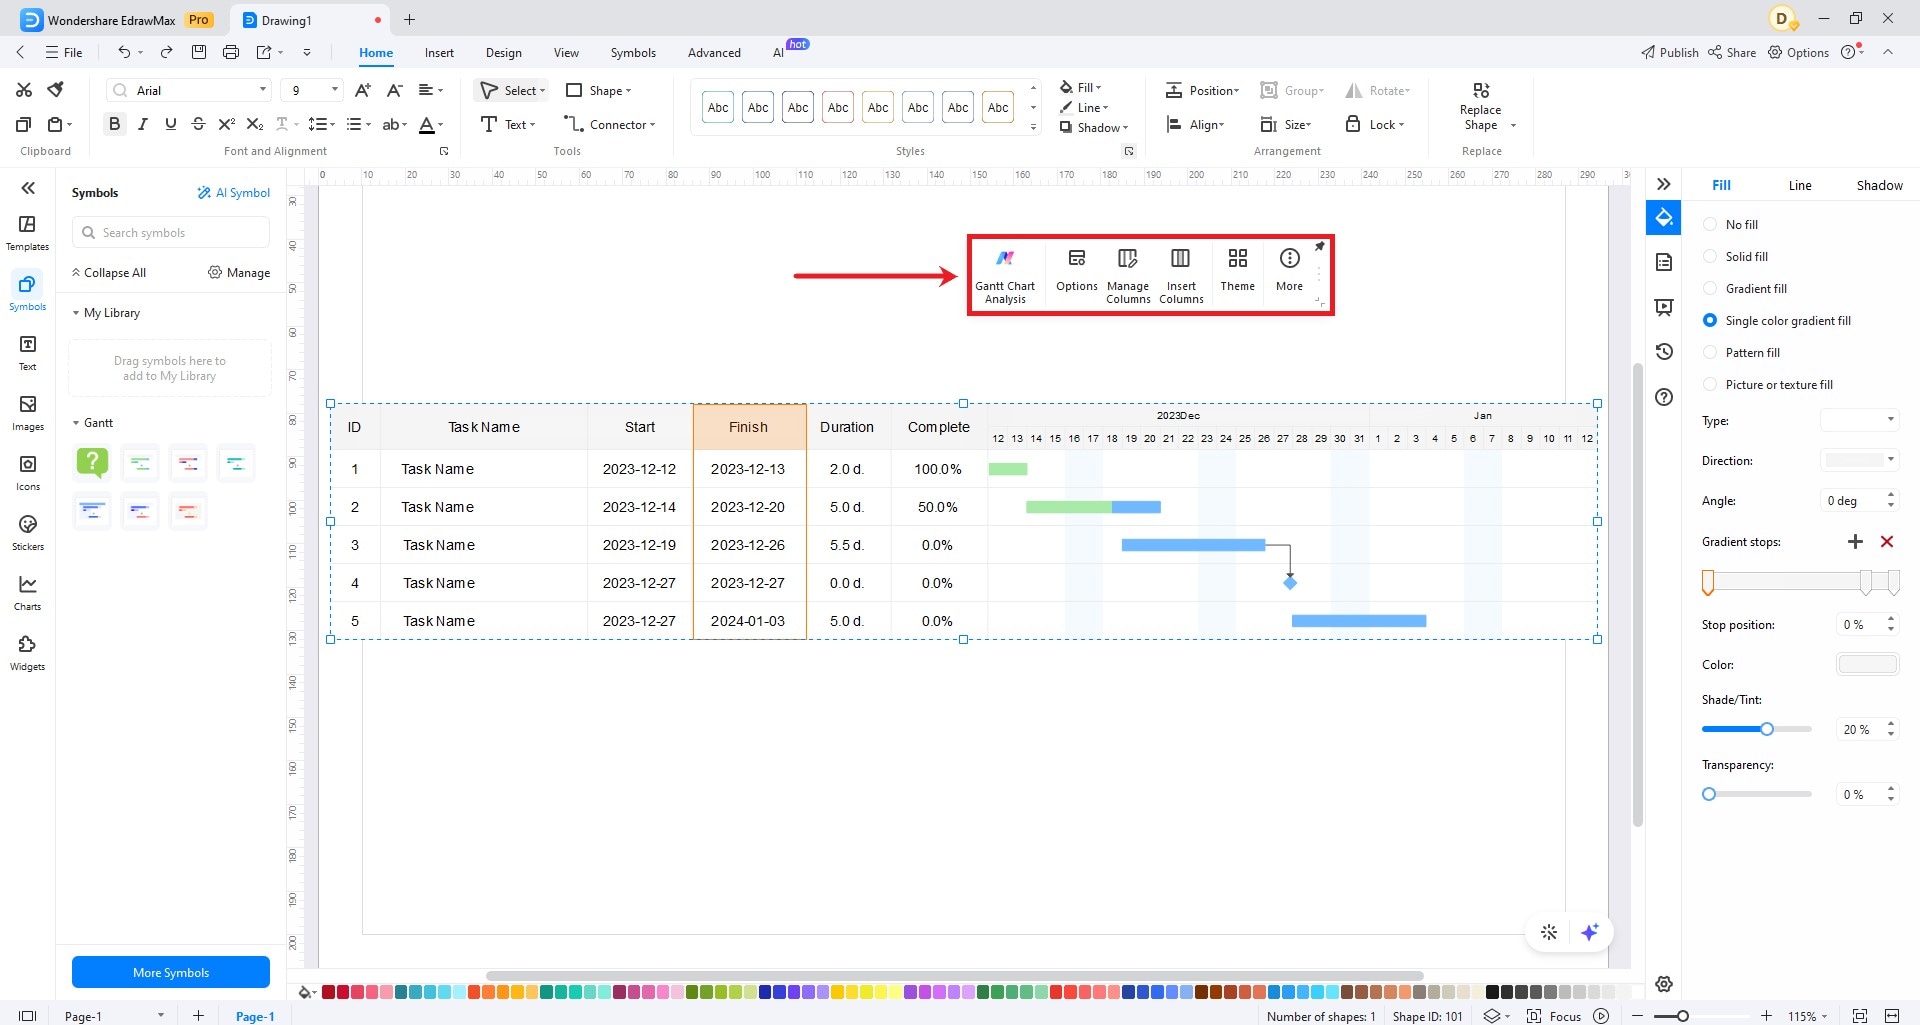
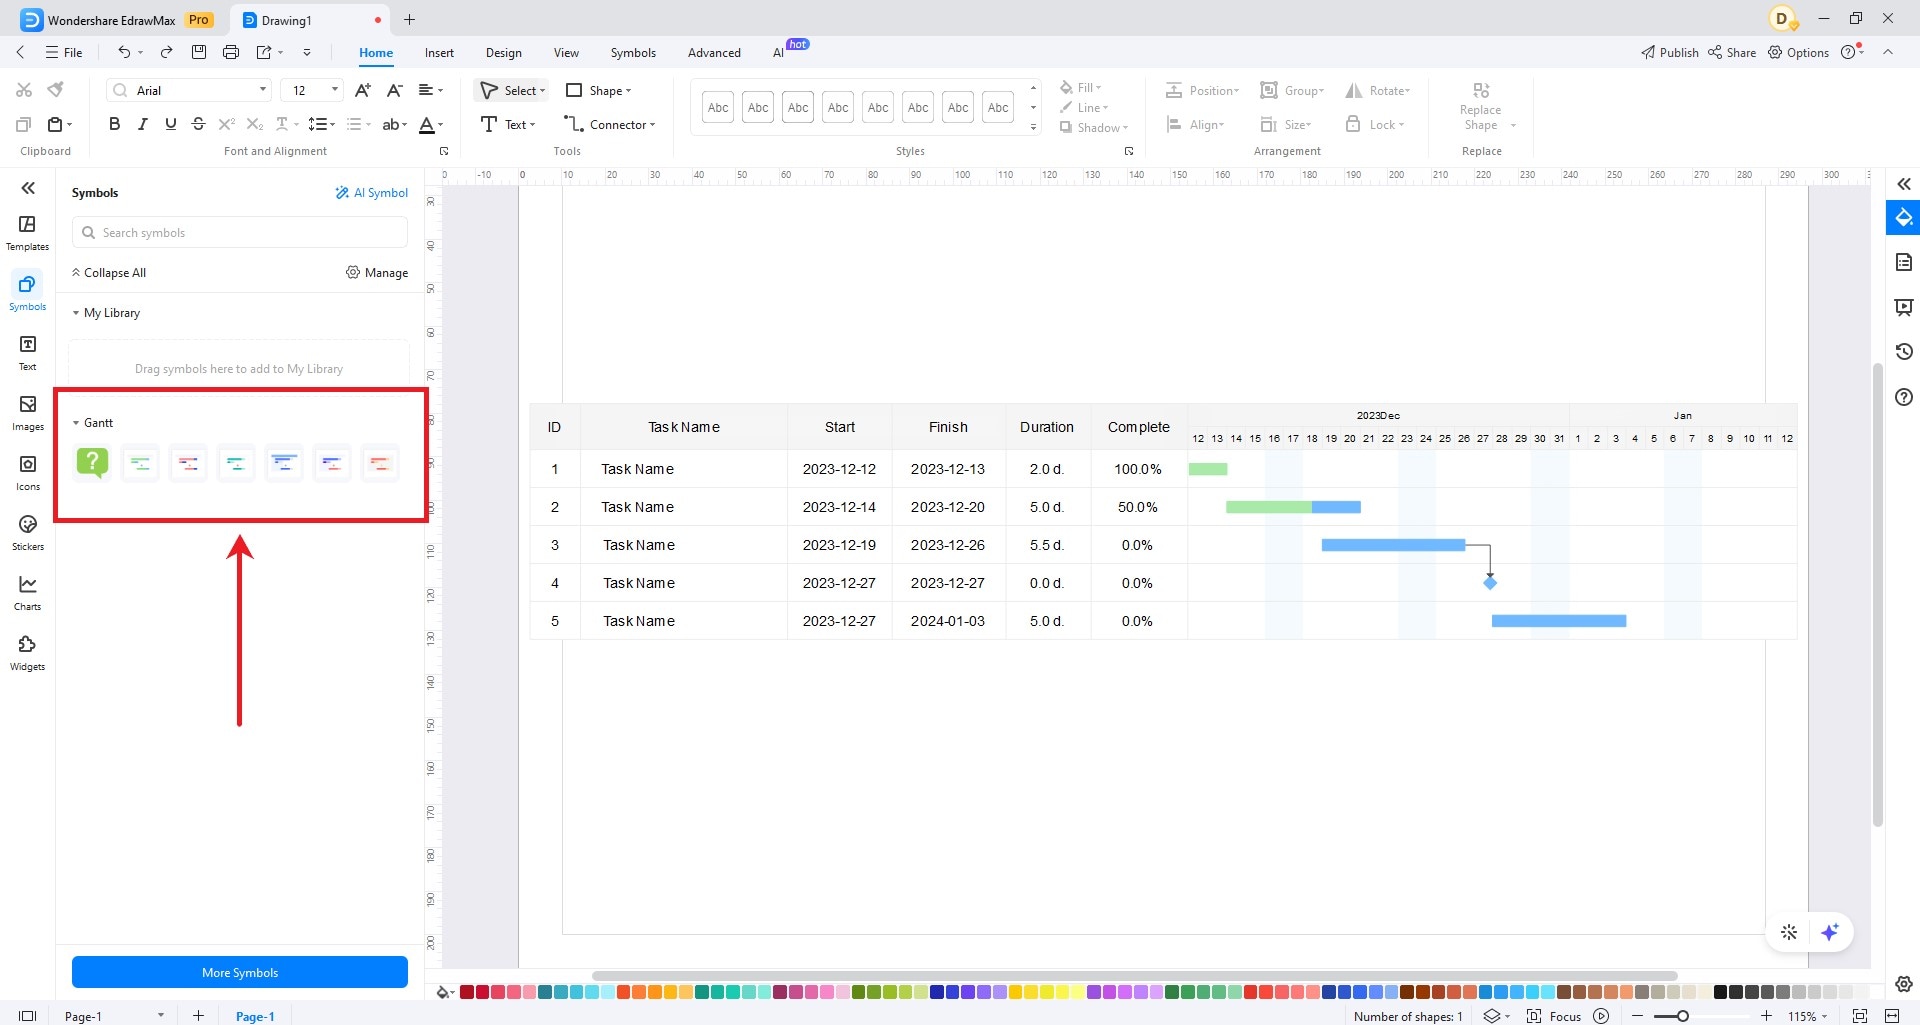
Step 2: From the Library panel, select your preferred Gantt chart design and drag it to the canvas.
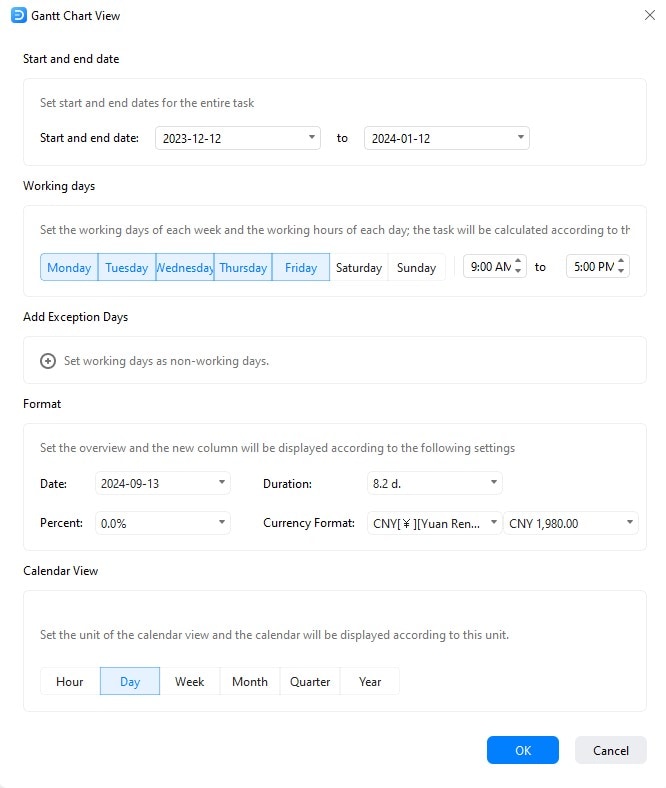
Step 3: Click Options in the Gantt Chart floating menu. A dialog box that contains the customization options will appear on the screen. Since you’re creating a Gantt chart from data, keep the default settings. Simply click OK to proceed.
Step 4: If you already have the data ready, simply import the file into the platform. Find and click More > Import on the Floating bar.

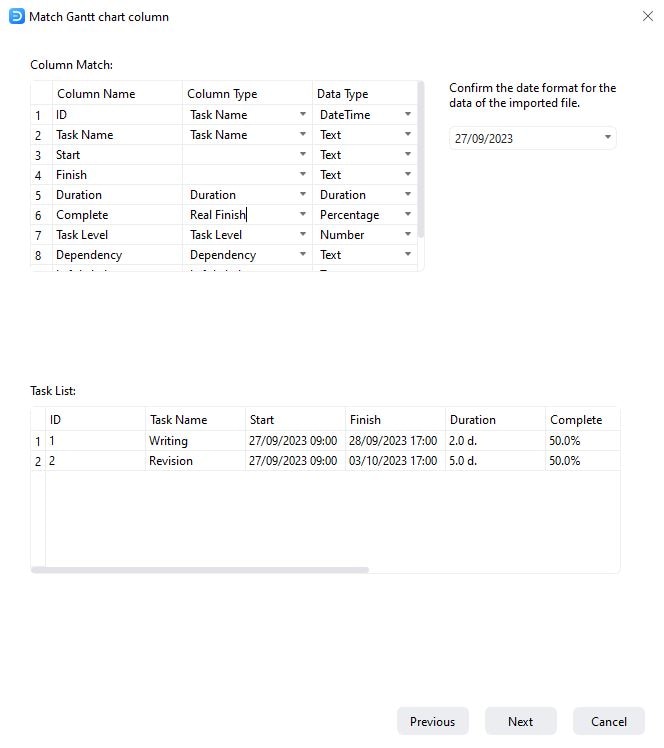
Step 5: Finalize the data and ensure it matches the Column Name, Column Type, and Data Type. Once you’re done, click Next to proceed.
Step 6: Navigate the Floating bar and the Right-side panel to customize the Gantt chart according to your preference.